in a Dynamic Environment - Domain-b
in a Dynamic Environment - Domain-b
in a Dynamic Environment - Domain-b
- No tags were found...

You also want an ePaper? Increase the reach of your titles
YUMPU automatically turns print PDFs into web optimized ePapers that Google loves.
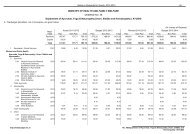
RevenuesRevenues from operationsThe Company’s total consolidated revenues <strong>in</strong>creased <strong>in</strong>fiscal 2009 to Rs.27,812.88 crore from Rs.22,619.52 crore<strong>in</strong> fiscal 2008, a growth of 22.96%. Information technologyand consultancy services revenues which was 96.29% ofrevenues <strong>in</strong> fiscal 2009 (94.77% <strong>in</strong> fiscal 2008) <strong>in</strong>creasedby 24.93 % to Rs.26,781.86 crore <strong>in</strong> fiscal 2009 fromRs.21,437.43 crore <strong>in</strong> fiscal 2008.Consolidated revenues from sale of equipmentand software licenses decreased by 12.78 % toRs.1,031.02 crore <strong>in</strong> fiscal 2009 from Rs.1,182.09 crore <strong>in</strong>fiscal 2008.Analysis of revenue growthThe <strong>in</strong>crease <strong>in</strong> revenues is ma<strong>in</strong>ly attributable to thegrowth <strong>in</strong> the volume of bus<strong>in</strong>ess (17.74%), impact ofexchange rates (10.80%) and acquisition ofTCS e-Serve Limited (1.59%). This was offset by reduction<strong>in</strong> bill<strong>in</strong>g rates (4.89%) and shift of on-site bus<strong>in</strong>ess tooffshore (2.27%). Shift of revenues from on-site to offshorewas a strategic decision.Revenue by segmentsThe classification of revenues by geography and <strong>in</strong>dustrypractice is more relevant when viewed on a consolidatedbasis.Revenue by geography% of revenuesGeography 2008-09 2007-08Americas 51.38 50.35UK 18.99 19.91Europe 10.53 9.28India 7.85 9.04AsiaPacific 4.75 5.27IberoAmericas 4.71 4.45Middle East and Africa 1.79 1.70Total 100.00 100.00The Company has been focus<strong>in</strong>g on diversify<strong>in</strong>g the sourceof its revenues from multiple geographies across theglobe.Revenues by <strong>in</strong>dustry practice% of revenuesMajor <strong>in</strong>dustry practice 2008-09 2007-08Bank<strong>in</strong>g, F<strong>in</strong>ancial Services andInsurance (BFSI) 43.32 44.61Manufactur<strong>in</strong>g 10.08 9.93Retail and Distribution 8.91 6.52Telecom 16.30 16.32Others 21.39 22.62Total 100.00 100.00Revenues from the BFSI segment have <strong>in</strong>creased byRs.1,955.94 crore <strong>in</strong> fiscal 2009. Major <strong>in</strong>dustry practiceverticals have grown well. Hi-Tech, Life Sciences andHealthcare, Energy Utilities and Transportation <strong>in</strong>cluded<strong>in</strong> ‘others’ <strong>in</strong> the above chart also witnessed good growth.Revenue by significant servicesService l<strong>in</strong>es 2008-09 2007-08% of % ofrevenues revenuesIT solutions and servicesApplication developmentand ma<strong>in</strong>tenance 48.46 48.34Bus<strong>in</strong>ess <strong>in</strong>telligence 8.13 9.66Enterprise solutions 12.60 13.10Assurance services 4.26 3.83Subtotal-IT solutions andservices 73.45 74.93Eng<strong>in</strong>eer<strong>in</strong>g and <strong>in</strong>dustrialservices 6.01 5.35Infrastructure services 8.04 6.54Global consult<strong>in</strong>g 2.68 3.36Asset leverage solutions 2.93 3.59Bus<strong>in</strong>ess process outsourc<strong>in</strong>g 6.89 6.23Total revenues 100.0 100.0The Company’s newer service offer<strong>in</strong>gs such asInfrastructure services, Assurance services and Bus<strong>in</strong>essProcess Outsourc<strong>in</strong>g have been show<strong>in</strong>g significantgrowth. Eng<strong>in</strong>eer<strong>in</strong>g and Industrial Services (EIS) bus<strong>in</strong>essis also grow<strong>in</strong>g.The Company generated 44.79% of its revenues <strong>in</strong> fiscal2009 from fixed price, fixed time contracts (44.06% <strong>in</strong>fiscal 2008).The distribution of Company’s revenues from on-site/off-shore <strong>in</strong> fiscal 2009 are as follows: off-shore services 44.22% (41.92% <strong>in</strong> fiscal 2008)75