Consolidated statement of changes in equitySEK MShare capitalPaid-incapitalTranslationreserveEquity attributable to equity holdersCash flowhedgereserveRetainedearningsTotalNon-controllinginterestsTotal equityEquity, January 1, 2010 1,269 502 2,221 –517 16,522 19,997 170 20,167Profit for the year 4,022 4,022 6 4,028Other comprehensive income for the year –1,446 73 650 –723 –15 –738Dividend to shareholders –2,582 –2,582 –39 –2,621Repurchases of 2,110,000 Series B shares –252 –252 –252Change in share-based payments for the year 208 208 208Equity, December 31, 2010/Equity, January 1, <strong>2011</strong> 1,269 710 775 –444 18,360 20,670 122 20,792Profit for the year 7,589 7,589 6 7,595Other comprehensive income for the year –352 –1,269 –2,295 –3,916 –1 –3,917Dividend to shareholders –4,945 –4,945 –2 –4,947Change in Group structure –29 –29 45 16Redemption of 3,150,000 Series D shares –9 9 0 0Repurchases of 1,800,000 Series B shares –184 –184 –184Change in share-based payments for the year 228 228 228Equity, December 31, <strong>2011</strong> 1,260 938 423 –1,713 18,505 19,413 170 19,583See also Note 26.100 <strong>Report</strong> of the Directors <strong>Skanska</strong> <strong>Annual</strong> <strong>Report</strong> <strong>2011</strong>
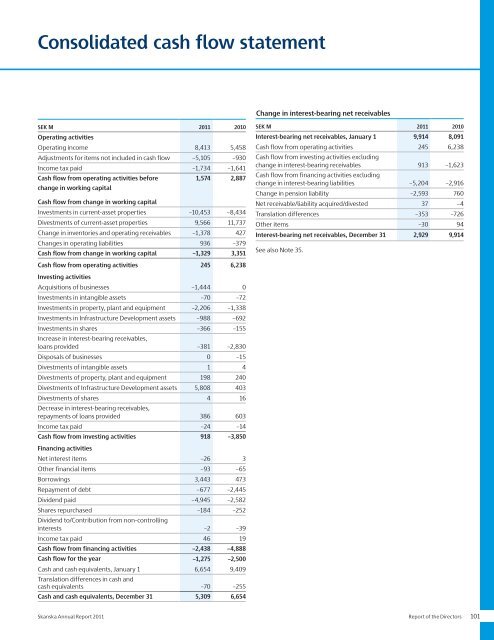
Consolidated cash flow statementChange in interest-bearing net receivablesSEK M <strong>2011</strong> 2010Operating activitiesOperating income 8,413 5,458Adjustments for items not included in cash flow –5,105 –930Income tax paid –1,734 –1,641Cash flow from operating activities beforechange in working capital1,574 2,887Cash flow from change in working capitalInvestments in current-asset properties –10,453 –8,434Divestments of current-asset properties 9,566 11,737Change in inventories and operating receivables –1,378 427Changes in operating liabilities 936 –379Cash flow from change in working capital –1,329 3,351Cash flow from operating activities 245 6,238Investing activitiesAcquisitions of businesses –1,444 0Investments in intangible assets –70 –72Investments in property, plant and equipment –2,206 –1,338Investments in Infrastructure Development assets –988 –692Investments in shares –366 –155Increase in interest-bearing receivables,loans provided –381 –2,830Disposals of businesses 0 –15Divestments of intangible assets 1 4Divestments of property, plant and equipment 198 240Divestments of Infrastructure Development assets 5,808 403Divestments of shares 4 16Decrease in interest-bearing receivables,repayments of loans provided 386 603Income tax paid –24 –14Cash flow from investing activities 918 –3,850Financing activitiesNet interest items –26 3Other financial items –93 –65Borrowings 3,443 473Repayment of debt –677 –2,445Dividend paid –4,945 –2,582Shares repurchased –184 –252Dividend to/Contribution from non-controllinginterests –2 –39Income tax paid 46 19Cash flow from financing activities –2,438 –4,888Cash flow for the year –1,275 –2,500Cash and cash equivalents, January 1 6,654 9,409Translation differences in cash andcash equivalents –70 –255Cash and cash equivalents, December 31 5,309 6,654SEK M <strong>2011</strong> 2010Interest-bearing net receivables, January 1 9,914 8,091Cash flow from operating activities 245 6,238Cash flow from investing activities excludingchange in interest-bearing receivables 913 –1,623Cash flow from financing activities excludingchange in interest-bearing liabilities –5,204 –2,916Change in pension liability –2,593 760Net receivable/liability acquired/divested 37 –4Translation differences –353 –726Other items –30 94Interest-bearing net receivables, December 31 2,929 9,914See also Note 35.<strong>Skanska</strong> <strong>Annual</strong> <strong>Report</strong> <strong>2011</strong> <strong>Report</strong> of the Directors 101
- Page 1 and 2:
Annual Report 2011
- Page 4 and 5:
NordenÖvriga EuropaIntäkterByggve
- Page 6:
2011 in briefFirst quarterSecond qu
- Page 9 and 10:
In Central Europe, our new green of
- Page 11 and 12:
”The business plan for 2011-2015
- Page 13 and 14:
Return on capital employed 2007−2
- Page 15 and 16:
20,000students participated.Safe ro
- Page 17 and 18:
per day to the blogenabled the gene
- Page 19 and 20:
”The divestment of the Group’s
- Page 21 and 22:
Skanska uses a Groupwide procedure
- Page 23 and 24:
New Karolinska Solna (NKS) , a univ
- Page 25 and 26:
A day on the job with John Crecco,
- Page 27:
A day on the job with Cecilia Fasth
- Page 30 and 31:
20 00010 00001999 2000 2001 2002 20
- Page 32 and 33:
Above left: United Nations Headquar
- Page 34 and 35:
Andel av orderstockenIncreased orde
- Page 36 and 37:
Nordic countriesAndel av orderstock
- Page 38 and 39:
Partihall InterchangeLength: 1,150
- Page 40 and 41:
Other European countriesAndel av or
- Page 42 and 43:
Heron TowerAddress: 110 Bishopsgate
- Page 44 and 45:
The AmericasAndel av orderstockenUS
- Page 46 and 47:
1960 - 20111960: Karl Koch Erecting
- Page 48 and 49:
Above left: Adjutantti, Helsinki, F
- Page 50 and 51:
New Planläggning markets in Poland
- Page 52 and 53:
Nordic countriesSwedenNorwayFinland
- Page 54 and 55: Other European countriesPolandCzech
- Page 56 and 57: Above left: Deloitte House, Warsaw,
- Page 58 and 59: 4. Byggande5. Förvaltning3. Uthyrn
- Page 60 and 61: Norden Europa AmerikaFördelningout
- Page 62 and 63: LustgårdenKvarteret Lustgården, L
- Page 64 and 65: EuropaAmerikaFördelningFördelning
- Page 66 and 67: AmerikaFördelningoutnyttjade Unite
- Page 68 and 69: Above left: London Hospital, London
- Page 70 and 71: 4. Constructionmanagement3. Leasing
- Page 72 and 73: Bedömt bruttonuvärdeGeografiKateg
- Page 74 and 75: A1 Expressway, PolandRoute: Gdańsk
- Page 76 and 77: Top left: Čertovo břemeno golf cl
- Page 78 and 79: Skanska’s Journey to Deep Green a
- Page 80 and 81: Initiatives in the carbon fieldThan
- Page 82 and 83: 876543210Skanska decided at an earl
- Page 84 and 85: 200100Skanska takes the lead0200420
- Page 86 and 87: Mdr kr175175The Board of Directors
- Page 88 and 89: Operating incomeSEK M 2011 2010Oper
- Page 90 and 91: Investments/DivestmentsSEK M 2011 2
- Page 92 and 93: Certain counterparties − for exam
- Page 94 and 95: The members and deputy members of t
- Page 96 and 97: Aside from day-to-day operations of
- Page 98 and 99: local management teams and were app
- Page 100 and 101: Consolidated income statementSEK M
- Page 102 and 103: Consolidated statement of financial
- Page 106 and 107: Consolidated cash flow statementCon
- Page 108 and 109: Parent Company balance sheetSEK M N
- Page 110 and 111: Parent Company cash flow statementS
- Page 112 and 113: Note01Consolidated accounting and v
- Page 114 and 115: Note01Continuedcontract premium is
- Page 116 and 117: Note01Continuedintended manner. Exa
- Page 118 and 119: Note01ContinuedIf the terms of a de
- Page 120 and 121: of transfers of resources to a comp
- Page 122 and 123: Note04Continued2011 ConstructionRes
- Page 124 and 125: Note04ContinuedExternal revenue by
- Page 126 and 127: Note06ContinuedSEK M Maturity Curre
- Page 128 and 129: 06NoteContinuedThe role of financia
- Page 130 and 131: Note06ContinuedReconciliation with
- Page 132 and 133: 06NoteContinuedCollateralThe Group
- Page 134 and 135: Note08RevenueNoteProjects in Skansk
- Page 136 and 137: Note13Impairment losses/Reversals o
- Page 138 and 139: Note16ContinuedTax assets and tax l
- Page 140 and 141: Note18GoodwillGoodwill is recognize
- Page 142 and 143: Note20Investments in joint ventures
- Page 144 and 145: Note20ContinuedInformation on the G
- Page 146 and 147: Note22Current-asset properties/Proj
- Page 148 and 149: Note26Equity/earnings per shareIn t
- Page 150 and 151: Note27Financial liabilitiesNoteFina
- Page 152 and 153: NotePension obligations2011 2010Jan
- Page 154 and 155:
Note31Specification of interest-bea
- Page 156 and 157:
Note33Assets pledged, contingent li
- Page 158 and 159:
34NoteContinuedConsolidated stateme
- Page 160 and 161:
35NoteContinuedRelation between con
- Page 162 and 163:
Note37Remuneration to senior execut
- Page 164 and 165:
37NoteContinuedRemuneration and ben
- Page 166 and 167:
NoteThe dilution effect through 201
- Page 168 and 169:
Note42Consolidatedquarterly results
- Page 170 and 171:
Note43Five-yearGroup financial summ
- Page 172 and 173:
Financial ratios etc. 4, 5 Dec 31,
- Page 174 and 175:
Parent Company notes45NoteFinancial
- Page 176 and 177:
Note51Financial non-current assets,
- Page 178 and 179:
Note58Liabilities, Parent CompanyLi
- Page 180 and 181:
Note63Related party disclosures, Pa
- Page 182 and 183:
Auditors’ ReportTo the Annual Sha
- Page 184 and 185:
180 Notes, including accounting and
- Page 186 and 187:
Senior Executive TeamJohan Karlstr
- Page 188 and 189:
Board of DirectorsSverker Martin-L
- Page 190 and 191:
Major events during 2011This page s
- Page 192 and 193:
Below are the investments, divestme
- Page 194 and 195:
Definitions and explanationsAverage
- Page 196 and 197:
Annual Shareholders’ MeetingInves
- Page 198 and 199:
1887 Aktiebolaget Skånska Cementgj
- Page 200:
Skanska ABwww.skanska.comRåsundav