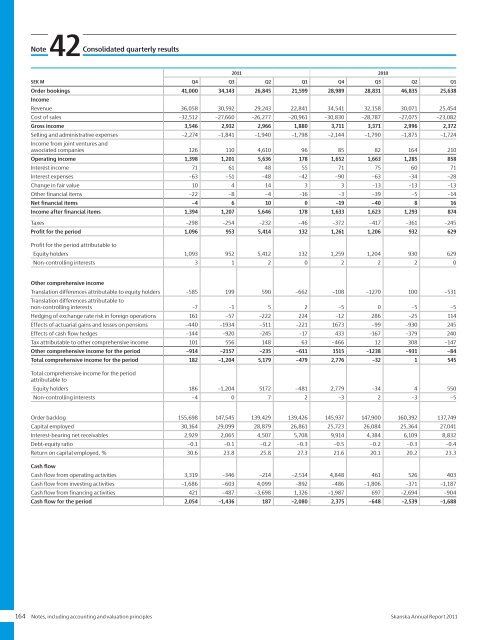
Note42Consolidatedquarterly resultsSEK M<strong>2011</strong> 2010Q4 Q3 Q2 Q1 Q4 Q3 Q2 Q1Order bookings 41,000 34,143 26,845 21,599 28,989 28,831 46,835 25,638IncomeRevenue 36,058 30,592 29,243 22,841 34,541 32,158 30,071 25,454Cost of sales –32,512 –27,660 –26,277 –20,961 –30,830 –28,787 –27,075 –23,082Gross income 3,546 2,932 2,966 1,880 3,711 3,371 2,996 2,372Selling and administrative expenses –2,274 –1,841 –1,940 –1,798 –2,144 –1,790 –1,875 –1,724Income from joint ventures andassociated companies 126 110 4,610 96 85 82 164 210Operating income 1,398 1,201 5,636 178 1,652 1,663 1,285 858Interest income 71 61 48 55 71 75 60 71Interest expenses –63 –51 –48 –42 –90 –63 –34 –28Change in fair value 10 4 14 3 3 –13 –13 –13Other financial items –22 –8 –4 –16 –3 –39 –5 –14Net financial items –4 6 10 0 –19 –40 8 16Income after financial items 1,394 1,207 5,646 178 1,633 1,623 1,293 874Taxes –298 –254 –232 –46 –372 –417 –361 –245Profit for the period 1,096 953 5,414 132 1,261 1,206 932 629Profit for the period attributable toEquity holders 1,093 952 5,412 132 1,259 1,204 930 629Non-controlling interests 3 1 2 0 2 2 2 0Other comprehensive incomeTranslation differences attributable to equity holders –585 199 590 –662 –108 –1270 100 –531Translation differences attributable tonon-controlling interests –7 –1 5 2 –5 0 –5 –5Hedging of exchange rate risk in foreign operations 161 –57 –222 224 –12 286 –25 114Effects of actuarial gains and losses on pensions –440 –1934 –511 –221 1673 –99 –930 245Effects of cash flow hedges –144 –920 –245 –17 433 –167 –379 240Tax attributable to other comprehensive income 101 556 148 63 –466 12 308 –147Other comprehensive income for the period –914 –2157 –235 –611 1515 –1238 –931 –84Total comprehensive income for the period 182 –1,204 5,179 –479 2,776 –32 1 545Total comprehensive income for the periodattributable toEquity holders 186 –1,204 5172 –481 2,779 –34 4 550Non-controlling interests –4 0 7 2 –3 2 –3 –5Order backlog 155,698 147,545 139,429 139,426 145,937 147,900 160,392 137,749Capital employed 30,164 29,099 28,879 26,861 25,723 26,084 25,364 27,041Interest-bearing net receivables 2,929 2,065 4,507 5,708 9,914 4,384 6,109 8,832Debt-equity ratio –0.1 –0.1 –0.2 –0.3 –0.5 –0.2 –0.3 –0.4Return on capital employed, % 30.6 23.8 25.8 27.3 21.6 20.1 20.2 23.3Cash flowCash flow from operating activities 3,319 –346 –214 –2,514 4,848 461 526 403Cash flow from investing activities –1,686 –603 4,099 –892 –486 –1,806 –371 –1,187Cash flow from financing activities 421 –487 –3,698 1,326 –1,987 697 –2,694 –904Cash flow for the period 2,054 –1,436 187 –2,080 2,375 –648 –2,539 –1,688164 Notes, including accounting and valuation principles <strong>Skanska</strong> <strong>Annual</strong> <strong>Report</strong> <strong>2011</strong>
NoteBusiness streamsSEK M42Continued<strong>2011</strong> 2010Q4 Q3 Q2 Q1 Q4 Q3 Q2 Q1Order bookingsConstruction 41,000 34,143 26,845 21,599 28,989 28,831 46,835 25,638Total 41,000 34,143 26,845 21,599 28,989 28,831 46,835 25,638RevenueConstruction 33,299 30,226 28,764 22,683 30,944 30,458 28,561 23,250Residential Development 2,033 1,254 1,482 994 1,794 1,202 1,311 1,206Commercial Property Development 3,018 403 757 161 2,970 1,211 1,319 1,777Infrastructure Development 29 24 145 88 84 131 76 28Central and eliminations –2,321 –1,315 –1,905 –1,085 –1,251 –844 –1,196 –807Total 36,058 30,592 29,243 22,841 34,541 32,158 30,071 25,454Operating incomeConstruction 787 1,260 1,095 325 1,288 1,407 1,135 558Residential Development 20 –68 45 –24 80 87 79 34Commercial Property Development 747 53 126 4 485 305 235 276Infrastructure Development 43 122 4,536 25 16 18 121 142Central –233 –160 –167 –138 –253 –163 –227 –149Eliminations 34 –6 1 –14 36 9 –58 –3Total 1,398 1,201 5,636 178 1,652 1,663 1,285 858<strong>Skanska</strong> <strong>Annual</strong> <strong>Report</strong> <strong>2011</strong> Notes, including accounting and valuation principles 165
- Page 1 and 2:
Annual Report 2011
- Page 4 and 5:
NordenÖvriga EuropaIntäkterByggve
- Page 6:
2011 in briefFirst quarterSecond qu
- Page 9 and 10:
In Central Europe, our new green of
- Page 11 and 12:
”The business plan for 2011-2015
- Page 13 and 14:
Return on capital employed 2007−2
- Page 15 and 16:
20,000students participated.Safe ro
- Page 17 and 18:
per day to the blogenabled the gene
- Page 19 and 20:
”The divestment of the Group’s
- Page 21 and 22:
Skanska uses a Groupwide procedure
- Page 23 and 24:
New Karolinska Solna (NKS) , a univ
- Page 25 and 26:
A day on the job with John Crecco,
- Page 27:
A day on the job with Cecilia Fasth
- Page 30 and 31:
20 00010 00001999 2000 2001 2002 20
- Page 32 and 33:
Above left: United Nations Headquar
- Page 34 and 35:
Andel av orderstockenIncreased orde
- Page 36 and 37:
Nordic countriesAndel av orderstock
- Page 38 and 39:
Partihall InterchangeLength: 1,150
- Page 40 and 41:
Other European countriesAndel av or
- Page 42 and 43:
Heron TowerAddress: 110 Bishopsgate
- Page 44 and 45:
The AmericasAndel av orderstockenUS
- Page 46 and 47:
1960 - 20111960: Karl Koch Erecting
- Page 48 and 49:
Above left: Adjutantti, Helsinki, F
- Page 50 and 51:
New Planläggning markets in Poland
- Page 52 and 53:
Nordic countriesSwedenNorwayFinland
- Page 54 and 55:
Other European countriesPolandCzech
- Page 56 and 57:
Above left: Deloitte House, Warsaw,
- Page 58 and 59:
4. Byggande5. Förvaltning3. Uthyrn
- Page 60 and 61:
Norden Europa AmerikaFördelningout
- Page 62 and 63:
LustgårdenKvarteret Lustgården, L
- Page 64 and 65:
EuropaAmerikaFördelningFördelning
- Page 66 and 67:
AmerikaFördelningoutnyttjade Unite
- Page 68 and 69:
Above left: London Hospital, London
- Page 70 and 71:
4. Constructionmanagement3. Leasing
- Page 72 and 73:
Bedömt bruttonuvärdeGeografiKateg
- Page 74 and 75:
A1 Expressway, PolandRoute: Gdańsk
- Page 76 and 77:
Top left: Čertovo břemeno golf cl
- Page 78 and 79:
Skanska’s Journey to Deep Green a
- Page 80 and 81:
Initiatives in the carbon fieldThan
- Page 82 and 83:
876543210Skanska decided at an earl
- Page 84 and 85:
200100Skanska takes the lead0200420
- Page 86 and 87:
Mdr kr175175The Board of Directors
- Page 88 and 89:
Operating incomeSEK M 2011 2010Oper
- Page 90 and 91:
Investments/DivestmentsSEK M 2011 2
- Page 92 and 93:
Certain counterparties − for exam
- Page 94 and 95:
The members and deputy members of t
- Page 96 and 97:
Aside from day-to-day operations of
- Page 98 and 99:
local management teams and were app
- Page 100 and 101:
Consolidated income statementSEK M
- Page 102 and 103:
Consolidated statement of financial
- Page 104 and 105:
Consolidated statement of changes i
- Page 106 and 107:
Consolidated cash flow statementCon
- Page 108 and 109:
Parent Company balance sheetSEK M N
- Page 110 and 111:
Parent Company cash flow statementS
- Page 112 and 113:
Note01Consolidated accounting and v
- Page 114 and 115:
Note01Continuedcontract premium is
- Page 116 and 117:
Note01Continuedintended manner. Exa
- Page 118 and 119: Note01ContinuedIf the terms of a de
- Page 120 and 121: of transfers of resources to a comp
- Page 122 and 123: Note04Continued2011 ConstructionRes
- Page 124 and 125: Note04ContinuedExternal revenue by
- Page 126 and 127: Note06ContinuedSEK M Maturity Curre
- Page 128 and 129: 06NoteContinuedThe role of financia
- Page 130 and 131: Note06ContinuedReconciliation with
- Page 132 and 133: 06NoteContinuedCollateralThe Group
- Page 134 and 135: Note08RevenueNoteProjects in Skansk
- Page 136 and 137: Note13Impairment losses/Reversals o
- Page 138 and 139: Note16ContinuedTax assets and tax l
- Page 140 and 141: Note18GoodwillGoodwill is recognize
- Page 142 and 143: Note20Investments in joint ventures
- Page 144 and 145: Note20ContinuedInformation on the G
- Page 146 and 147: Note22Current-asset properties/Proj
- Page 148 and 149: Note26Equity/earnings per shareIn t
- Page 150 and 151: Note27Financial liabilitiesNoteFina
- Page 152 and 153: NotePension obligations2011 2010Jan
- Page 154 and 155: Note31Specification of interest-bea
- Page 156 and 157: Note33Assets pledged, contingent li
- Page 158 and 159: 34NoteContinuedConsolidated stateme
- Page 160 and 161: 35NoteContinuedRelation between con
- Page 162 and 163: Note37Remuneration to senior execut
- Page 164 and 165: 37NoteContinuedRemuneration and ben
- Page 166 and 167: NoteThe dilution effect through 201
- Page 170 and 171: Note43Five-yearGroup financial summ
- Page 172 and 173: Financial ratios etc. 4, 5 Dec 31,
- Page 174 and 175: Parent Company notes45NoteFinancial
- Page 176 and 177: Note51Financial non-current assets,
- Page 178 and 179: Note58Liabilities, Parent CompanyLi
- Page 180 and 181: Note63Related party disclosures, Pa
- Page 182 and 183: Auditors’ ReportTo the Annual Sha
- Page 184 and 185: 180 Notes, including accounting and
- Page 186 and 187: Senior Executive TeamJohan Karlstr
- Page 188 and 189: Board of DirectorsSverker Martin-L
- Page 190 and 191: Major events during 2011This page s
- Page 192 and 193: Below are the investments, divestme
- Page 194 and 195: Definitions and explanationsAverage
- Page 196 and 197: Annual Shareholders’ MeetingInves
- Page 198 and 199: 1887 Aktiebolaget Skånska Cementgj
- Page 200: Skanska ABwww.skanska.comRåsundav