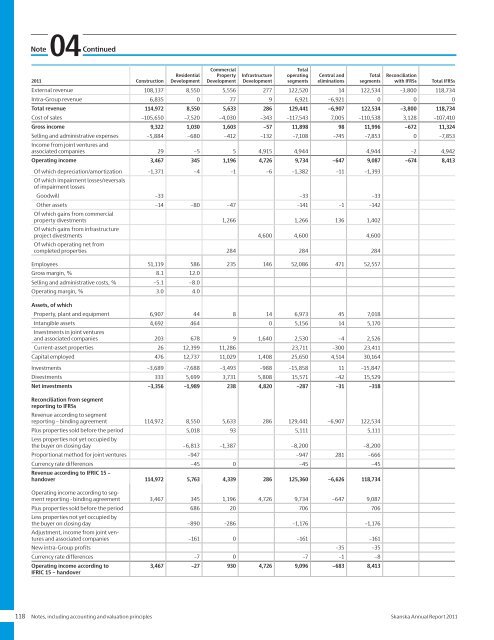
Note04Continued<strong>2011</strong> ConstructionResidentialDevelopmentCommercialPropertyDevelopmentInfrastructureDevelopmentTotaloperatingsegmentsCentral andeliminationsTotalsegmentsReconciliationwith IFRSsTotal IFRSsExternal revenue 108,137 8,550 5,556 277 122,520 14 122,534 –3,800 118,734Intra-Group revenue 6,835 0 77 9 6,921 –6,921 0 0 0Total revenue 114,972 8,550 5,633 286 129,441 –6,907 122,534 –3,800 118,734Cost of sales –105,650 –7,520 –4,030 –343 –117,543 7,005 –110,538 3,128 –107,410Gross income 9,322 1,030 1,603 –57 11,898 98 11,996 –672 11,324Selling and administrative expenses –5,884 –680 –412 –132 –7,108 –745 –7,853 0 –7,853Income from joint ventures andassociated companies 29 –5 5 4,915 4,944 4,944 –2 4,942Operating income 3,467 345 1,196 4,726 9,734 –647 9,087 –674 8,413Of which depreciation/amortization –1,371 –4 –1 –6 –1,382 –11 –1,393Of which impairment losses/reversalsof impairment lossesGoodwill –33 –33 –33Other assets –14 –80 –47 –141 –1 –142Of which gains from commercialproperty divestments 1,266 1,266 136 1,402Of which gains from infrastructureproject divestments 4,600 4,600 4,600Of which operating net fromcompleted properties 284 284 284Employees 51,119 586 235 146 52,086 471 52,557Gross margin, % 8.1 12.0Selling and administrative costs, % –5.1 –8.0Operating margin, % 3.0 4.0Assets, of whichProperty, plant and equipment 6,907 44 8 14 6,973 45 7,018Intangible assets 4,692 464 0 5,156 14 5,170Investments in joint venturesand associated companies 203 678 9 1,640 2,530 –4 2,526Current-asset properties 26 12,399 11,286 23,711 –300 23,411Capital employed 476 12,737 11,029 1,408 25,650 4,514 30,164Investments –3,689 –7,688 –3,493 –988 –15,858 11 –15,847Divestments 333 5,699 3,731 5,808 15,571 –42 15,529Net investments –3,356 –1,989 238 4,820 –287 –31 –318Reconciliation from segmentreporting to IFRSsRevenue according to segmentreporting – binding agreement 114,972 8,550 5,633 286 129,441 –6,907 122,534Plus properties sold before the period 5,018 93 5,111 5,111Less properties not yet occupied bythe buyer on closing day –6,813 –1,387 –8,200 –8,200Proportional method for joint ventures –947 –947 281 –666Currency rate differences –45 0 –45 –45Revenue according to IFRIC 15 –handover 114,972 5,763 4,339 286 125,360 –6,626 118,734Operating income according to segmentreporting - binding agreement 3,467 345 1,196 4,726 9,734 –647 9,087Plus properties sold before the period 686 20 706 706Less properties not yet occupied bythe buyer on closing day –890 –286 –1,176 –1,176Adjustment, income from joint venturesand associated companies –161 0 –161 –161New intra-Group profits –35 –35Currency rate differences –7 0 –7 –1 –8Operating income according toIFRIC 15 – handover3,467 –27 930 4,726 9,096 –683 8,413118 Notes, including accounting and valuation principles <strong>Skanska</strong> <strong>Annual</strong> <strong>Report</strong> <strong>2011</strong>
Note04Continued2010 ConstructionResidentialDevelopmentCommercialPropertyDevelopmentInfrastructureDevelopmentTotaloperatingsegmentsCentral andeliminationsTotalsegmentsReconciliationwith IFRSsTotal IFRSsExternal revenue 108,923 7,462 4,648 319 121,352 311 121,663 561 122,224Intra-Group revenue 4,290 119 0 0 4,409 –4,409 0 0 0Total revenue 113,213 7,581 4,648 319 125,761 –4,098 121,663 561 122,224Cost of sales –103,076 –6,486 –3,371 –420 –113,353 3,966 –109,387 –387 –109,774Gross income 10,137 1,095 1,277 –101 12,408 –132 12,276 174 12,450Selling and administrative expenses –5,764 –589 –355 –138 –6,846 –687 –7,533 0 –7,533Income from joint ventures andassociated companies 15 53 –2 536 602 –6 596 –55 541Operating income 4,388 559 920 297 6,164 –825 5,339 119 5,458Of which depreciation/amortization –1,282 –4 –2 –6 –1,294 –7 –1,301Of which impairment losses/reversalsof impairment lossesGoodwill –108 –108 –108Other assets –19 –35 18 –36 –106 –142Of which gains from commercialproperty divestments 791 791 80 871Of which gains from infrastructureproject divestments 192 192 192Of which operating net from completedproperties 392 392 392Employees 50,197 649 199 140 51,185 460 51,645Gross margin, % 9.0 14.4Selling and administrative costs, % –5.1 –7.8Operating margin, % 3.9 7.4Assets, of whichProperty, plant and equipment 5,798 53 9 19 5,879 27 5,906Intangible assets 3,604 467 186 4,257 14 4,271Investments in joint venturesand associated companies 202 320 3 1,250 1,775 1,775Current-asset properties 174 10,125 10,113 20,412 –6 20,406Assets held for sale 1,108 1,108 1,108Capital employed –1,602 10,188 9,608 2,681 20,875 4,848 25,723Investments –1,351 –5,562 –3,147 –692 –10,752 3 –10,749Divestments 272 5,281 6,571 403 12,527 76 12,603Net investments –1,079 –281 3,424 –289 1,775 79 1,854Reconciliation from segment reportingto IFRSsRevenue according to segmentreporting – binding agreement 113,213 7,581 4,648 319 125,761 –4,098 121,663Plus properties sold before the period 3,160 2,781 5,941 5,941Less properties not yet occupied bythe buyer on closing day –5,018 –93 –5,111 –5,111Currency rate differences –210 –59 –269 –269Revenue according to IFRIC 15 –handover 113,213 5,513 7,277 319 126,322 –4,098 122,224Operating income according to segmentreporting - binding agreement 4,388 559 920 297 6,164 –825 5,339Plus properties sold before the period 489 401 890 17 907Less properties not yet occupied bythe buyer on closing day –686 –20 –706 –706Adjustment, income from joint venturesand associated companies –55 0 –55 –55Currency rate differences –27 0 –27 –27Operating income according toIFRIC 15 – handover4,388 280 1,301 297 6,266 –808 5,458<strong>Skanska</strong> <strong>Annual</strong> <strong>Report</strong> <strong>2011</strong> Notes, including accounting and valuation principles 119
- Page 1 and 2:
Annual Report 2011
- Page 4 and 5:
NordenÖvriga EuropaIntäkterByggve
- Page 6:
2011 in briefFirst quarterSecond qu
- Page 9 and 10:
In Central Europe, our new green of
- Page 11 and 12:
”The business plan for 2011-2015
- Page 13 and 14:
Return on capital employed 2007−2
- Page 15 and 16:
20,000students participated.Safe ro
- Page 17 and 18:
per day to the blogenabled the gene
- Page 19 and 20:
”The divestment of the Group’s
- Page 21 and 22:
Skanska uses a Groupwide procedure
- Page 23 and 24:
New Karolinska Solna (NKS) , a univ
- Page 25 and 26:
A day on the job with John Crecco,
- Page 27:
A day on the job with Cecilia Fasth
- Page 30 and 31:
20 00010 00001999 2000 2001 2002 20
- Page 32 and 33:
Above left: United Nations Headquar
- Page 34 and 35:
Andel av orderstockenIncreased orde
- Page 36 and 37:
Nordic countriesAndel av orderstock
- Page 38 and 39:
Partihall InterchangeLength: 1,150
- Page 40 and 41:
Other European countriesAndel av or
- Page 42 and 43:
Heron TowerAddress: 110 Bishopsgate
- Page 44 and 45:
The AmericasAndel av orderstockenUS
- Page 46 and 47:
1960 - 20111960: Karl Koch Erecting
- Page 48 and 49:
Above left: Adjutantti, Helsinki, F
- Page 50 and 51:
New Planläggning markets in Poland
- Page 52 and 53:
Nordic countriesSwedenNorwayFinland
- Page 54 and 55:
Other European countriesPolandCzech
- Page 56 and 57:
Above left: Deloitte House, Warsaw,
- Page 58 and 59:
4. Byggande5. Förvaltning3. Uthyrn
- Page 60 and 61:
Norden Europa AmerikaFördelningout
- Page 62 and 63:
LustgårdenKvarteret Lustgården, L
- Page 64 and 65:
EuropaAmerikaFördelningFördelning
- Page 66 and 67:
AmerikaFördelningoutnyttjade Unite
- Page 68 and 69:
Above left: London Hospital, London
- Page 70 and 71:
4. Constructionmanagement3. Leasing
- Page 72 and 73: Bedömt bruttonuvärdeGeografiKateg
- Page 74 and 75: A1 Expressway, PolandRoute: Gdańsk
- Page 76 and 77: Top left: Čertovo břemeno golf cl
- Page 78 and 79: Skanska’s Journey to Deep Green a
- Page 80 and 81: Initiatives in the carbon fieldThan
- Page 82 and 83: 876543210Skanska decided at an earl
- Page 84 and 85: 200100Skanska takes the lead0200420
- Page 86 and 87: Mdr kr175175The Board of Directors
- Page 88 and 89: Operating incomeSEK M 2011 2010Oper
- Page 90 and 91: Investments/DivestmentsSEK M 2011 2
- Page 92 and 93: Certain counterparties − for exam
- Page 94 and 95: The members and deputy members of t
- Page 96 and 97: Aside from day-to-day operations of
- Page 98 and 99: local management teams and were app
- Page 100 and 101: Consolidated income statementSEK M
- Page 102 and 103: Consolidated statement of financial
- Page 104 and 105: Consolidated statement of changes i
- Page 106 and 107: Consolidated cash flow statementCon
- Page 108 and 109: Parent Company balance sheetSEK M N
- Page 110 and 111: Parent Company cash flow statementS
- Page 112 and 113: Note01Consolidated accounting and v
- Page 114 and 115: Note01Continuedcontract premium is
- Page 116 and 117: Note01Continuedintended manner. Exa
- Page 118 and 119: Note01ContinuedIf the terms of a de
- Page 120 and 121: of transfers of resources to a comp
- Page 124 and 125: Note04ContinuedExternal revenue by
- Page 126 and 127: Note06ContinuedSEK M Maturity Curre
- Page 128 and 129: 06NoteContinuedThe role of financia
- Page 130 and 131: Note06ContinuedReconciliation with
- Page 132 and 133: 06NoteContinuedCollateralThe Group
- Page 134 and 135: Note08RevenueNoteProjects in Skansk
- Page 136 and 137: Note13Impairment losses/Reversals o
- Page 138 and 139: Note16ContinuedTax assets and tax l
- Page 140 and 141: Note18GoodwillGoodwill is recognize
- Page 142 and 143: Note20Investments in joint ventures
- Page 144 and 145: Note20ContinuedInformation on the G
- Page 146 and 147: Note22Current-asset properties/Proj
- Page 148 and 149: Note26Equity/earnings per shareIn t
- Page 150 and 151: Note27Financial liabilitiesNoteFina
- Page 152 and 153: NotePension obligations2011 2010Jan
- Page 154 and 155: Note31Specification of interest-bea
- Page 156 and 157: Note33Assets pledged, contingent li
- Page 158 and 159: 34NoteContinuedConsolidated stateme
- Page 160 and 161: 35NoteContinuedRelation between con
- Page 162 and 163: Note37Remuneration to senior execut
- Page 164 and 165: 37NoteContinuedRemuneration and ben
- Page 166 and 167: NoteThe dilution effect through 201
- Page 168 and 169: Note42Consolidatedquarterly results
- Page 170 and 171: Note43Five-yearGroup financial summ
- Page 172 and 173:
Financial ratios etc. 4, 5 Dec 31,
- Page 174 and 175:
Parent Company notes45NoteFinancial
- Page 176 and 177:
Note51Financial non-current assets,
- Page 178 and 179:
Note58Liabilities, Parent CompanyLi
- Page 180 and 181:
Note63Related party disclosures, Pa
- Page 182 and 183:
Auditors’ ReportTo the Annual Sha
- Page 184 and 185:
180 Notes, including accounting and
- Page 186 and 187:
Senior Executive TeamJohan Karlstr
- Page 188 and 189:
Board of DirectorsSverker Martin-L
- Page 190 and 191:
Major events during 2011This page s
- Page 192 and 193:
Below are the investments, divestme
- Page 194 and 195:
Definitions and explanationsAverage
- Page 196 and 197:
Annual Shareholders’ MeetingInves
- Page 198 and 199:
1887 Aktiebolaget Skånska Cementgj
- Page 200:
Skanska ABwww.skanska.comRåsundav