Technical Report for the Maricunga Gold Mine - Kinross Gold
Technical Report for the Maricunga Gold Mine - Kinross Gold
Technical Report for the Maricunga Gold Mine - Kinross Gold
- No tags were found...

You also want an ePaper? Increase the reach of your titles
YUMPU automatically turns print PDFs into web optimized ePapers that Google loves.
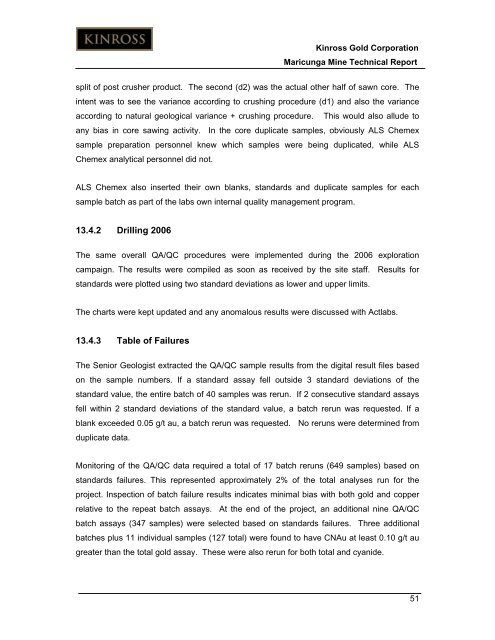
<strong>Kinross</strong> <strong>Gold</strong> Corporation<strong>Maricunga</strong> <strong>Mine</strong> <strong>Technical</strong> <strong>Report</strong>split of post crusher product. The second (d2) was <strong>the</strong> actual o<strong>the</strong>r half of sawn core. Theintent was to see <strong>the</strong> variance according to crushing procedure (d1) and also <strong>the</strong> varianceaccording to natural geological variance + crushing procedure. This would also allude toany bias in core sawing activity. In <strong>the</strong> core duplicate samples, obviously ALS Chemexsample preparation personnel knew which samples were being duplicated, while ALSChemex analytical personnel did not.ALS Chemex also inserted <strong>the</strong>ir own blanks, standards and duplicate samples <strong>for</strong> eachsample batch as part of <strong>the</strong> labs own internal quality management program.13.4.2 Drilling 2006The same overall QA/QC procedures were implemented during <strong>the</strong> 2006 explorationcampaign. The results were compiled as soon as received by <strong>the</strong> site staff. Results <strong>for</strong>standards were plotted using two standard deviations as lower and upper limits.The charts were kept updated and any anomalous results were discussed with Actlabs.13.4.3 Table of FailuresThe Senior Geologist extracted <strong>the</strong> QA/QC sample results from <strong>the</strong> digital result files basedon <strong>the</strong> sample numbers. If a standard assay fell outside 3 standard deviations of <strong>the</strong>standard value, <strong>the</strong> entire batch of 40 samples was rerun. If 2 consecutive standard assaysfell within 2 standard deviations of <strong>the</strong> standard value, a batch rerun was requested. If ablank exceeded 0.05 g/t au, a batch rerun was requested. No reruns were determined fromduplicate data.Monitoring of <strong>the</strong> QA/QC data required a total of 17 batch reruns (649 samples) based onstandards failures. This represented approximately 2% of <strong>the</strong> total analyses run <strong>for</strong> <strong>the</strong>project. Inspection of batch failure results indicates minimal bias with both gold and copperrelative to <strong>the</strong> repeat batch assays. At <strong>the</strong> end of <strong>the</strong> project, an additional nine QA/QCbatch assays (347 samples) were selected based on standards failures. Three additionalbatches plus 11 individual samples (127 total) were found to have CNAu at least 0.10 g/t augreater than <strong>the</strong> total gold assay. These were also rerun <strong>for</strong> both total and cyanide.51