Technical Report for the Maricunga Gold Mine - Kinross Gold
Technical Report for the Maricunga Gold Mine - Kinross Gold
Technical Report for the Maricunga Gold Mine - Kinross Gold
- No tags were found...
You also want an ePaper? Increase the reach of your titles
YUMPU automatically turns print PDFs into web optimized ePapers that Google loves.
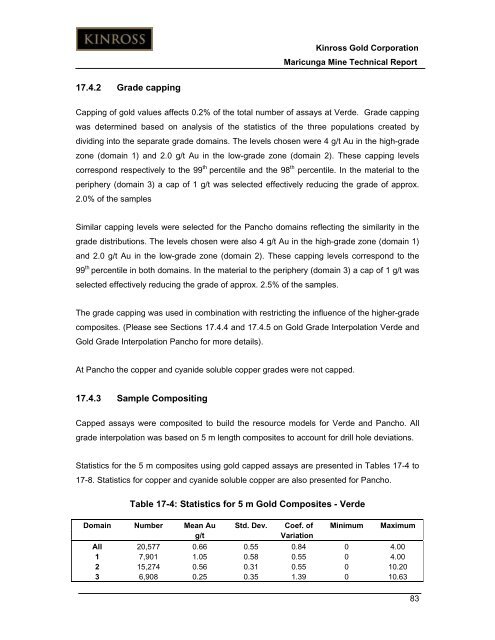
<strong>Kinross</strong> <strong>Gold</strong> Corporation<strong>Maricunga</strong> <strong>Mine</strong> <strong>Technical</strong> <strong>Report</strong>17.4.2 Grade cappingCapping of gold values affects 0.2% of <strong>the</strong> total number of assays at Verde. Grade cappingwas determined based on analysis of <strong>the</strong> statistics of <strong>the</strong> three populations created bydividing into <strong>the</strong> separate grade domains. The levels chosen were 4 g/t Au in <strong>the</strong> high-gradezone (domain 1) and 2.0 g/t Au in <strong>the</strong> low-grade zone (domain 2). These capping levelscorrespond respectively to <strong>the</strong> 99 th percentile and <strong>the</strong> 98 th percentile. In <strong>the</strong> material to <strong>the</strong>periphery (domain 3) a cap of 1 g/t was selected effectively reducing <strong>the</strong> grade of approx.2.0% of <strong>the</strong> samplesSimilar capping levels were selected <strong>for</strong> <strong>the</strong> Pancho domains reflecting <strong>the</strong> similarity in <strong>the</strong>grade distributions. The levels chosen were also 4 g/t Au in <strong>the</strong> high-grade zone (domain 1)and 2.0 g/t Au in <strong>the</strong> low-grade zone (domain 2). These capping levels correspond to <strong>the</strong>99 th percentile in both domains. In <strong>the</strong> material to <strong>the</strong> periphery (domain 3) a cap of 1 g/t wasselected effectively reducing <strong>the</strong> grade of approx. 2.5% of <strong>the</strong> samples.The grade capping was used in combination with restricting <strong>the</strong> influence of <strong>the</strong> higher-gradecomposites. (Please see Sections 17.4.4 and 17.4.5 on <strong>Gold</strong> Grade Interpolation Verde and<strong>Gold</strong> Grade Interpolation Pancho <strong>for</strong> more details).At Pancho <strong>the</strong> copper and cyanide soluble copper grades were not capped.17.4.3 Sample CompositingCapped assays were composited to build <strong>the</strong> resource models <strong>for</strong> Verde and Pancho. Allgrade interpolation was based on 5 m length composites to account <strong>for</strong> drill hole deviations.Statistics <strong>for</strong> <strong>the</strong> 5 m composites using gold capped assays are presented in Tables 17-4 to17-8. Statistics <strong>for</strong> copper and cyanide soluble copper are also presented <strong>for</strong> Pancho.Table 17-4: Statistics <strong>for</strong> 5 m <strong>Gold</strong> Composites - VerdeDomain Number Mean Au Std. Dev. Coef. of Minimum Maximumg/tVariationAll 20,577 0.66 0.55 0.84 0 4.001 7,901 1.05 0.58 0.55 0 4.002 15,274 0.56 0.31 0.55 0 10.203 6,908 0.25 0.35 1.39 0 10.6383


