- Page 2 and 3:
The designationsemployed and thepre
- Page 4 and 5:
The organisers of the meeting want
- Page 6 and 7:
Milking variables in relation to te
- Page 8 and 9:
Modelling of liner behaviour using
- Page 10 and 11:
ForewordThe second half of the part
- Page 13 and 14:
Rosatiorganizations. The “Lactati
- Page 15 and 16:
Rosatito guarantee correctness of s
- Page 17 and 18:
RosatiICAR also sponsors books belo
- Page 19 and 20:
Technical developments in Slovak co
- Page 21 and 22:
Technical developments in Slovak co
- Page 23 and 24:
Technical developments in Slovak co
- Page 25 and 26:
de Koning & HuijsmanThe Dutch Quali
- Page 27 and 28:
de Koning & Huijsmanare Medicines,
- Page 29 and 30:
de Koning & HuijsmanThe pulsation c
- Page 31 and 32:
de Koning & HuijsmanBalances which
- Page 33 and 34:
Tancin et al.Physiology of milk let
- Page 35 and 36:
Tancin et al.In the dairy practice
- Page 37 and 38:
Tancin et al.Mayer, H., D. Schams,
- Page 39 and 40:
Effect of machine milking on teatIn
- Page 41 and 42:
Effect of machine milking on teatBe
- Page 43 and 44:
Effect of machine milking on teatTa
- Page 45 and 46:
Effect of machine milking on teatNe
- Page 47 and 48:
Measurements of vacuum stabilityInt
- Page 49 and 50:
Measurements of vacuum stabilityTab
- Page 51 and 52:
Measurements of vacuum stabilityFor
- Page 53 and 54:
Marnet et al.Comparative study of p
- Page 55 and 56: Marnet et al.production during the
- Page 57 and 58: Marnet et al.prestimulation by the
- Page 59 and 60: Worstorff & BilgeryEffects of liner
- Page 61 and 62: Worstorff & BilgeryTable 1 summaris
- Page 63 and 64: Worstorff & Bilgeryseries 40/32 kPa
- Page 65 and 66: Differential staining of somatic ce
- Page 67 and 68: Different diagnostic measures for m
- Page 69 and 70: Different diagnostic measures for m
- Page 71 and 72: Different diagnostic measures for m
- Page 73 and 74: Evaluation of milking routine by La
- Page 75 and 76: Evaluation of milking routine by La
- Page 77 and 78: Fryc et al.The assessment parameter
- Page 79 and 80: Fryc et al.p n[kPa]p n1p n2p npt st
- Page 81 and 82: Fryc et al.rate. There were three s
- Page 83 and 84: Milking devices disturbance on SCCm
- Page 85 and 86: Milking devices disturbance on SCCL
- Page 87 and 88: Milking devices disturbance on SCCT
- Page 89 and 90: Turki & WinnickiMilking variables i
- Page 91 and 92: Table1. Milk flow time from in indi
- Page 93 and 94: Table 2. First minute milk flow, av
- Page 95 and 96: Turki & WinnickiMayer H., Schams D.
- Page 97 and 98: Milk recording in GermanyTable 1. E
- Page 99 and 100: Milk recording in GermanyTable 3. A
- Page 101 and 102: Milk recording in GermanyTable 5. M
- Page 103 and 104: Main fields ofactivities of theGerm
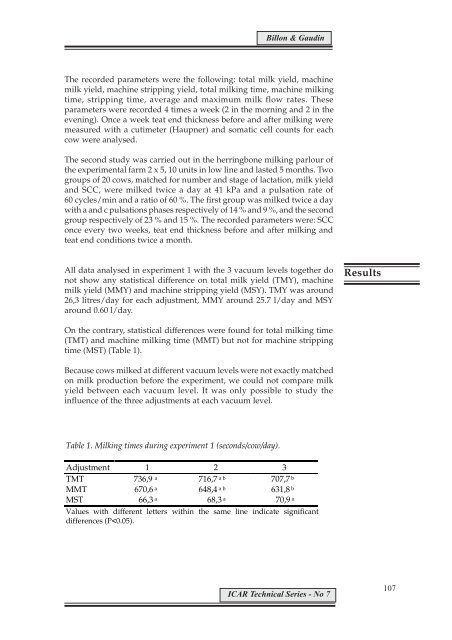
- Page 105: Influence of duration of a and c ph
- Page 109 and 110: Influence of duration of a and c ph
- Page 111 and 112: Nosal & BilgeryVibrations and vacuu
- Page 113 and 114: Nosal & BilgerykPa45.645.445.245.04
- Page 115 and 116: Nosal & BilgeryIn case of problems
- Page 117 and 118: Testing of vacuum during milkingEva
- Page 119 and 120: Testing of vacuum during milkingthe
- Page 121 and 122: Ryšánek et al.Vacuum fluctuation
- Page 123 and 124: Ryšánek et al.Teat injuries were
- Page 125 and 126: Ryšánek et al.Particular attentio
- Page 127 and 128: de KoningAutomatic milking:Chances
- Page 129 and 130: de Koningfor some time after the mi
- Page 131 and 132: de KoningMilk quality is without do
- Page 133 and 134: de Koningwhen the bulk tank is empt
- Page 135 and 136: de KoningLand, A. van ‘t et al, 2
- Page 137 and 138: Characterising the farms equipped w
- Page 139 and 140: Characterising the farms equipped w
- Page 141 and 142: Characterising the farms equipped w
- Page 143 and 144: Characterising the farms equipped w
- Page 145 and 146: Characterising the farms equipped w
- Page 147 and 148: Designing optimal robotic milking b
- Page 149 and 150: Designing optimal robotic milking b
- Page 151 and 152: Designing optimal robotic milking b
- Page 153 and 154: ArtmannThe effects of automatic mil
- Page 155 and 156: ArtmannData was collected on the ma
- Page 157 and 158:
ArtmannThe differences of the co-ef
- Page 159 and 160:
BarthEvaluation of somatic cell cou
- Page 161 and 162:
BarthTable 1. Determined and real m
- Page 163 and 164:
Barthyield is often a side effect o
- Page 165 and 166:
Milking parameters in modified milk
- Page 167 and 168:
Pallas & WendtThe development of ud
- Page 169 and 170:
Pallas & WendtSCC (x 1,000) / ml250
- Page 171 and 172:
Pallas & WendtTrilk, J. und Münch,
- Page 173 and 174:
Udder health and milk low profilesA
- Page 175 and 176:
Udder health and milk low profilesD
- Page 177 and 178:
AMS in Czech RepublicThis farm size
- Page 179 and 180:
AMS in Czech RepublicTable 1. Effec
- Page 181 and 182:
AMS in Czech RepublicFigure 1. Stab
- Page 183 and 184:
BruckmaierSpecific aspects of milk
- Page 185 and 186:
Bruckmaiertowards the end of lactat
- Page 187 and 188:
BruckmaierBruckmaier, R.M., D. Scha
- Page 189 and 190:
Teat callosity and mastitisResultsT
- Page 191 and 192:
de Koning et al.Milking characteris
- Page 193 and 194:
de Koning et al.Table 1. Statistica
- Page 195 and 196:
Influence of ageing on linersThe re
- Page 197 and 198:
Neijenhuis & HogeveenMilking interv
- Page 199 and 200:
Knízková et al.Effect of old and
- Page 201 and 202:
Knízková et al.Thermograms of the
- Page 203 and 204:
Knízková et al.Kunc, P., Knízkov
- Page 205 and 206:
Postmilking teat disinfectingIntrod
- Page 207 and 208:
Postmilking teat disinfectingNDT an
- Page 209 and 210:
Los & MaškováTeatcup hardness aft
- Page 211 and 212:
Los & MaškováIt follows from the
- Page 213 and 214:
Trends in milking equipmentThe fina
- Page 215 and 216:
Olechnowicz & TurkiMilking and milk
- Page 217 and 218:
Table 2. Milk components and somati
- Page 219 and 220:
Lipinski et al.Effect of some selec
- Page 221 and 222:
Lipinski et al.Milk hygiene quality
- Page 223 and 224:
Lipinski et al.1. The technical and
- Page 225 and 226:
Effect of two milking systems on te
- Page 227 and 228:
Effect of two milking systems on te
- Page 229 and 230:
Milk quality and mastitis monitorin
- Page 231 and 232:
Nitra in ICAR interlaboratory studi
- Page 233 and 234:
Botto et al.Effect of ultrasound in
- Page 235 and 236:
Báder et al.Change of udder confor
- Page 237 and 238:
Báder et al.6050%4030201.scor.2.sc
- Page 239 and 240:
Luger et al.Effect of inclination a
- Page 241 and 242:
Luger et al.There is no difference
- Page 243 and 244:
Harty et al.Modelling of liner beha
- Page 245 and 246:
Harty et al.A solid plane was const
- Page 247 and 248:
Provolo & SangiorgiUsing daily data
- Page 249 and 250:
Provolo & SangiorgiFigure 3. Averag
- Page 251 and 252:
Provolo & SangiorgiFigure 7. Cow no
- Page 253 and 254:
Provolo & Sangiorgistandardisation
- Page 255 and 256:
Cognome/iInhibition of oxytocin rel
- Page 257 and 258:
Tancin et al.Milk flow patterns: in
- Page 259 and 260:
Szlachta & AleksanderThe influence
- Page 261 and 262:
Szlachta & Aleksanderforces in the
- Page 263 and 264:
Szlachta & Aleksanderpressure diffe
- Page 265 and 266:
List of participantsŠtefan BodoSPU
- Page 267 and 268:
List of participantsMarian GregušI
- Page 269 and 270:
List of participantsMarija KlopcicD
- Page 271 and 272:
List of participantsŠtefan MihinaV
- Page 273 and 274:
List of participantsEduard Pravnans
- Page 275 and 276:
List of participantsJozef Tonhauser