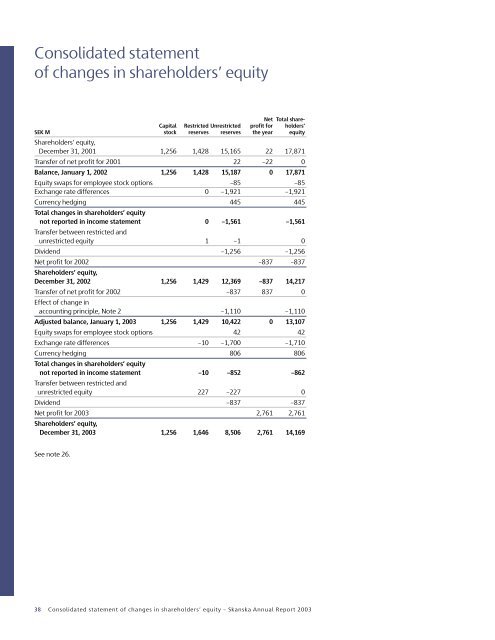
Consolidated statementof changes in shareholders’ equityNet Total share-Capital Restricted Unrestricted profit for holders’SEK M stock reserves reserves the year equityShareholders’ equity,December 31, 2001 1,256 1,428 15,165 22 17,871Transfer of net profit for 2001 22 –22 0Balance, January 1, 2002 1,256 1,428 15,187 0 17,871Equity swaps for employee stock options –85 –85Exchange rate differences 0 –1,921 –1,921Currency hedging 445 445Total changes in shareholders’ equitynot reported in income statement 0 –1,561 –1,561Transfer between restricted andunrestricted equity 1 –1 0Dividend –1,256 –1,256Net profit for 2002 –837 –837Shareholders’ equity,December 31, 2002 1,256 1,429 12,369 –837 14,217Transfer of net profit for 2002 –837 837 0Effect of change inaccounting principle, Note 2 –1,110 –1,110Adjusted balance, January 1, <strong>2003</strong> 1,256 1,429 10,422 0 13,107Equity swaps for employee stock options 42 42Exchange rate differences –10 –1,700 –1,710Currency hedging 806 806Total changes in shareholders’ equitynot reported in income statement –10 –852 –862Transfer between restricted andunrestricted equity 227 –227 0Dividend –837 –837Net profit for <strong>2003</strong> 2,761 2,761Shareholders’ equity,December 31, <strong>2003</strong> 1,256 1,646 8,506 2,761 14,169See note 26.38 Consolidated statement of changes in shareholders’ equity – <strong>Skanska</strong> <strong>Annual</strong> <strong>Report</strong> <strong>2003</strong>
Consolidated cash flow statementSEK M Note <strong>2003</strong> 2002Business operationsOperating income 4,532 981Adjustments for items not included in cash flow –1,090 3,297Taxes paid –925 –1,401Cash flow from business operations beforechange in working capital 2,517 2,877Cash flow from change in working capitalAcquisitions of current-asset properties –5,353 –6,946Divestments of current-asset properties 12,985 7,799Change in inventories and operating receivables, 481 4,731Change in operating liabilities 432 –4,732Cash flow from change in working capital 8,545 852Cash flow from business operations 11,062 3,729Investment operationsAcquisitions of Group companies 5 –90 –498Acquisitions of intangible fixed assets –51 –52Acquisitions of tangible fixed assets –1,309 –1,636Acquisitions of assets in BOT operations –115 –579Acquisitions of shares 10 –41Increase in interest-bearing receivables,loans provided –1,423 –1,262Divestments of businesses 5 66 0Divestments of intangible fixed assets 4 9Divestments of tangible fixed assets 381 522Divestments of assets in BOT operations 1 0Divestments of shares 433 351Decrease in interest-bearing receivables,repayments of loans provided 164 1,119Taxes paid 722 –944Cash flow from investment operations –1,207 –3,011Financing operationsNet interest items –393 –631Other financial items –37 –37Borrowings 552 2,614Retirement of debt –7,360 –3,586Dividend paid –837 –1,256Distributed to minority interests –27 –50Taxes paid 135 156Cash flow from financing operations –7,967 –2,790SEK M Note <strong>2003</strong> 2002Change in interest-bearing net debtNet debt on January 1 –9,376 –7,376Cash flow from business operations 11,062 3,729Cash flow from financing operations excludingchange in interest-bearing receivables 52 –2,868Cash flow from financing operations excludingchange in interest-bearing liabilities –1,159 –1,818Change in accounting principle for pensionsin compliance with RR 29 –1,362Change in interest-bearing pensions –656Other reclassifications –459 247Net debt acquired/retired 846 –175Exchange rate differences 427 –389Other reclassifications 119 –70Net debt on December 31 150 –9,376Consolidated operating cash flow statementCash flow from business operations beforechange in working capital and taxes paid 3,442 4,278Change in working capital excludingcurrent-asset properties 913 –1Net investments in business operations 6,510 –2,025Cash flow effect, adjustment in paymentdates of net investments 1 48 1,142Cash flow before taxes paid 10,913 3,394Taxes paid in business operations –943 –1,428Cash flow from business operations 9,970 1,966Net interest items and other financial items –430 –668Change in interest-bearing receivablesand liabilities –8,067 –1,115Taxes paid in financing operations 135 156Cash flow from financing operations –8,362 –1,627Cash flow from operations 1,608 339Net strategic investments 404 –188Taxes paid on strategic investments 740 –917Cash flow from strategic investments 1,144 –1,105Dividend etc. –864 –1,306Cash flow for the year 1,888 –2,0721 ”Adjustment in payment dates of net investments” refers to payments made during the year inquestion related to investments/divestments in prior years, or unpaid investments/divestmentsrelated to the year in question.Cash flow for the year 1,888 –2,072Liquid assets on January 1 5,763 8,630Translation differences in liquid assets –614 –795Liquid assets on December 31 7,037 5,763See note 34.<strong>Skanska</strong> <strong>Annual</strong> <strong>Report</strong> <strong>2003</strong> – Consolidated cash flow statement 39