Note 5 continuedAcquired assets and liabilities according to acquisition balance sheets were<strong>2003</strong> 2002AssetsIntangible fixed assets 75 247Tangible fixed assets 66 707Shares and participations 10 0Current-asset properties 0 101Inventories, tax claims and operating receivables 204 311Liquid assets 200 17Total 555 1 383LiabilitiesMinority interests –40 0Interest-bearing provisions and liabilities 28 277Non-interest-bearing provisions and liabilities 277 591Total 265 868Purchase price paid –290 –515Liquid assets in the acquired companies 200 17Effect on consolidated liquid assets, investment –90 –498Divestments of Group companiesDuring the year, a number of Group companies were divested.The project development company Spectrum <strong>Skanska</strong> in the United States wassold in the second quarter, with a gain of SEK 14 M. The gain was attributable in itsentirety to exchange rate differences previously reported directly in shareholders’equity.During the second quarter, <strong>Skanska</strong>’s Norwegian unit sold its 50 percent stake inthe steel and concrete company Contiga AS. The divestment led to a capital gain ofSEK 53 M.A company in Russia, Sovetskaya, was also sold with a capital gain.Otherwise a number of small companies in the Baltic countries were sold at aminor loss.In 2002, divestments consisted of a small number of Group companies in Poland.Divested assets and liabilities<strong>2003</strong> 2002AssetsIntangible fixed assets –23 –6Tangible fixed assets –165 –141Shares and participations –1 0Current-asset properties –896 –25Inventories, tax claims and operating receivables –206 –188Liquid assets –230 0Total –1,521 –360Shareholders’ equity and liabilitiesGain on sale of Group companies 47 0Minority interests –18 0Interest-bearing provisions and liabilities –874 –102Non-interest-bearing provisions and liabilities –380 –258Total –1,225 –360Purchase price received 296 0Liquid assets in divested companies –230 0Effect on consolidated liquid assets, divestments 66 0Other mattersRegarding information on provisions for each individual company acquisition,see Note 27, ”Provisions.” Regarding information on goodwill amortizationapportioned over the amortization period, see Note 17, ”Intangible fixed assets.”Note 6Net salesProjects in <strong>Skanska</strong>’s contracting operations are reported in compliance with RR 10, ”Construction contracts and similar assignments.” Revenues other than project revenuesare reported in compliance with RR 11,”Revenues”. See ”Accounting and valuation principles,” Note 1.Net sales by primary and secondary segmentGroup Secondary segments: Geographic markets Central TotalPrimary segments: Other Nordic Other United Other and netBusiness streams Sweden countries Europe States markets eliminations sales<strong>2003</strong>Construction and Services 25,881 19,531 23,939 45,460 6,791 121,602Commercial Project Development 7,450 472 939 8,861Residential Project Development 2,415 2,778 898 189 54 6,334BOT 87 87Other businesses, eliminationof intra-Group transactions –1,011 –1,702 –1,292 –4,005Total 34,735 21,079 25,776 45,649 6,932 –1,292 132,8792002Construction and Services 26,583 20,434 26,717 56,023 6,604 136,361Commercial Project Development 1,780 74 360 2,214Residential Project Development 2,469 2,927 720 1,145 72 7,333BOT 38 38Other businesses, eliminationof intra-Group transactions –1,049 –1,651 –113 –1,100 –3,913Total 29,783 21,784 27,684 57,168 6,714 –1,100 142,03358 Notes, including accounting and valuation principles – <strong>Skanska</strong> <strong>Annual</strong> <strong>Report</strong> <strong>2003</strong>
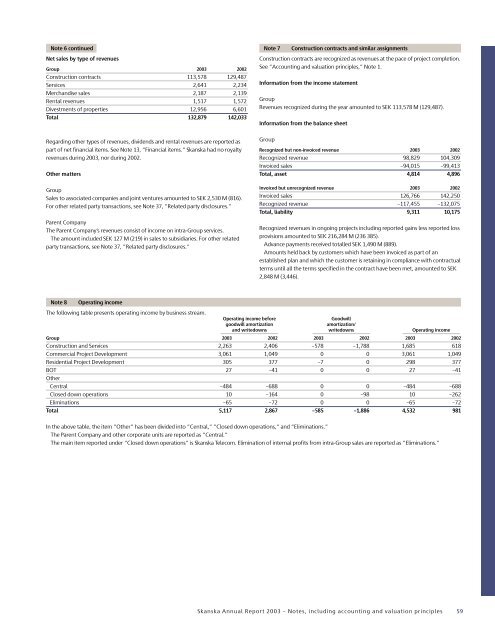
Note 6 continuedNet sales by type of revenuesGroup <strong>2003</strong> 2002Construction contracts 113,578 129,487Services 2,641 2,234Merchandise sales 2,187 2,139Rental revenues 1,517 1,572Divestments of properties 12,956 6,601Total 132,879 142,033Regarding other types of revenues, dividends and rental revenues are reported aspart of net financial items. See Note 13, ”Financial items.” <strong>Skanska</strong> had no royaltyrevenues during <strong>2003</strong>, nor during 2002.Other mattersGroupSales to associated companies and joint ventures amounted to SEK 2,530 M (816).For other related party transactions, see Note 37, ”Related party disclosures.”Parent CompanyThe Parent Company’s revenues consist of income on intra-Group services.The amount included SEK 127 M (219) in sales to subsidiaries. For other relatedparty transactions, see Note 37, ”Related party disclosures.”Note 7Construction contracts and similar assignmentsConstruction contracts are recognized as revenues at the pace of project completion.See ”Accounting and valuation principles,” Note 1.Information from the income statementGroupRevenues recognized during the year amounted to SEK 113,578 M (129,487).Information from the balance sheetGroupRecognized but non-invoiced revenue <strong>2003</strong> 2002Recognized revenue 98,829 104,309Invoiced sales –94,015 –99,413Total, asset 4,814 4,896Invoiced but unrecognized revenue <strong>2003</strong> 2002Invoiced sales 126,766 142,250Recognized revenue –117,455 –132,075Total, liability 9,311 10,175Recognized revenues in ongoing projects including reported gains less reported lossprovisions amounted to SEK 216,284 M (236 385).Advance payments received totalled SEK 1,490 M (889).Amounts held back by customers which have been invoiced as part of anestablished plan and which the customer is retaining in compliance with contractualterms until all the terms specified in the contract have been met, amounted to SEK2,848 M (3,446).Note 8Operating incomeThe following table presents operating income by business stream.Operating income beforeGoodwillgoodwill amortizationamortization/and writedowns writedowns Operating incomeGroup <strong>2003</strong> 2002 <strong>2003</strong> 2002 <strong>2003</strong> 2002Construction and Services 2,263 2,406 –578 –1,788 1,685 618Commercial Project Development 3,061 1,049 0 0 3,061 1,049Residential Project Development 305 377 –7 0 298 377BOT 27 –41 0 0 27 –41OtherCentral –484 –688 0 0 –484 –688Closed down operations 10 –164 0 –98 10 –262Eliminations –65 –72 0 0 –65 –72Total 5,117 2,867 –585 –1,886 4,532 981In the above table, the item ”Other” has been divided into ”Central,” ”Closed down operations,” and ”Eliminations.”The Parent Company and other corporate units are reported as ”Central.”The main item reported under ”Closed down operations” is <strong>Skanska</strong> Telecom. Elimination of internal profits from intra-Group sales are reported as ”Eliminations.”<strong>Skanska</strong> <strong>Annual</strong> <strong>Report</strong> <strong>2003</strong> – Notes, including accounting and valuation principles 59