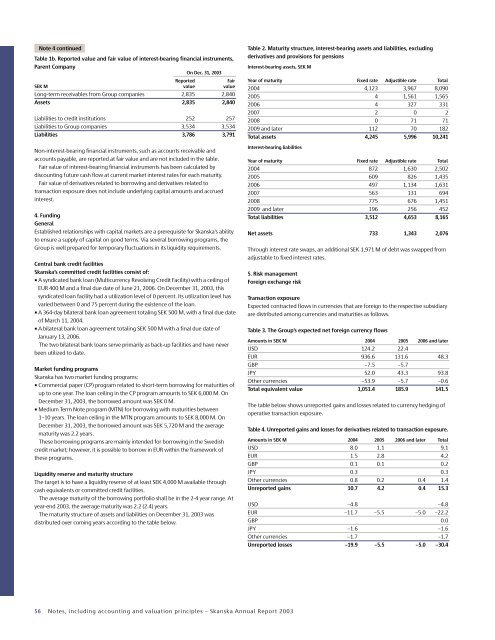
Note 4 continuedTable 1b. <strong>Report</strong>ed value and fair value of interest-bearing financial instruments,Parent CompanyOn Dec. 31, <strong>2003</strong><strong>Report</strong>edFairSEK M value valueLong-term receivables from Group companies 2,835 2,840Assets 2,835 2,840Liabilities to credit institutions 252 257Liabilities to Group companies 3,534 3,534Liabilities 3,786 3,791Non-interest-bearing financial instruments, such as accounts receivable andaccounts payable, are reported at fair value and are not included in the table.Fair value of interest-bearing financial instruments has been calculated bydiscounting future cash flow at current market interest rates for each maturity.Fair value of derivatives related to borrowing and derivatives related totransaction exposure does not include underlying capital amounts and accruedinterest.4. FundingGeneralEstablished relationships with capital markets are a prerequisite for <strong>Skanska</strong>’s abilityto ensure a supply of capital on good terms. Via several borrowing programs, theGroup is well prepared for temporary fluctuations in its liquidity requirements.Central bank credit facilities<strong>Skanska</strong>’s committed credit facilities consist of:• A syndicated bank loan (Multicurrency Revolving Credit Facility) with a ceiling ofEUR 400 M and a final due date of June 21, 2006. On December 31, <strong>2003</strong>, thissyndicated loan facility had a utilization level of 0 percent. Its utilization level hasvaried between 0 and 75 percent during the existence of the loan.• A 364-day bilateral bank loan agreement totaling SEK 500 M, with a final due dateof March 11, 2004.• A bilateral bank loan agreement totaling SEK 500 M with a final due date ofJanuary 13, 2006.The two bilateral bank loans serve primarily as back-up facilities and have neverbeen utilized to date.Market funding programs<strong>Skanska</strong> has two market funding programs:• Commercial paper (CP) program related to short-term borrowing for maturities ofup to one year. The loan ceiling in the CP program amounts to SEK 6,000 M. OnDecember 31, <strong>2003</strong>, the borrowed amount was SEK 0 M.• Medium Term Note program (MTN) for borrowing with maturities between1–10 years. The loan ceiling in the MTN program amounts to SEK 8,000 M. OnDecember 31, <strong>2003</strong>, the borrowed amount was SEK 5,720 M and the averagematurity was 2.2 years.These borrowing programs are mainly intended for borrowing in the Swedishcredit market; however, it is possible to borrow in EUR within the framework ofthese programs.Liquidity reserve and maturity structureThe target is to have a liquidity reserve of at least SEK 4,000 M available throughcash equivalents or committed credit facilities.The average maturity of the borrowing portfolio shall be in the 2-4 year range. Atyear-end <strong>2003</strong>, the average maturity was 2.2 (2.4) years.The maturity structure of assets and liabilities on December 31, <strong>2003</strong> wasdistributed over coming years according to the table below.Table 2. Maturity structure, interest-bearing assets and liabilities, excludingderivatives and provisions for pensionsInterest-bearing assets, SEK MYear of maturity Fixed rate Adjustible rate Total2004 4,123 3,967 8,0902005 4 1,561 1,5652006 4 327 3312007 2 0 22008 0 71 712009 and later 112 70 182Total assets 4,245 5,996 10,241Interest-bearing liabilitiesYear of maturity Fixed rate Adjustible rate Total2004 872 1,630 2,5022005 609 826 1,4352006 497 1,134 1,6312007 563 131 6942008 775 676 1,4512009 and later 196 256 452Total liabilities 3,512 4,653 8,165Net assets 733 1,343 2,076Through interest rate swaps, an additional SEK 1,971 M of debt was swapped fromadjustable to fixed interest rates.5. Risk managementForeign exchange riskTransaction exposureExpected contracted flows in currencies that are foreign to the respective subsidiaryare distributed among currencies and maturities as follows.Table 3. The Group’s expected net foreign currency flowsAmounts in SEK M 2004 2005 2006 and laterUSD 124.2 22.4EUR 936.6 131.6 48.3GBP –7.5 –5.7JPY 52.0 43.3 93.8Other currencies –53.9 –5.7 –0.6Total equivalent value 1,051.4 185.9 141.5The table below shows unreported gains and losses related to currency hedging ofoperative transaction exposure.Table 4. Unreported gains and losses for derivatives related to transaction exposure.Amounts in SEK M 2004 2005 2006 and later TotalUSD 8.0 1.1 9.1EUR 1.5 2.8 4.2GBP 0.1 0.1 0.2JPY 0.3 0.3Other currencies 0.8 0.2 0.4 1.4Unreported gains 10.7 4.2 0.4 15.3USD –4.8 –4.8EUR –11.7 –5.5 –5.0 –22.2GBP 0.0JPY –1.6 –1.6Other currencies –1.7 –1.7Unreported losses –19.9 –5.5 –5.0 –30.456 Notes, including accounting and valuation principles – <strong>Skanska</strong> <strong>Annual</strong> <strong>Report</strong> <strong>2003</strong>
Note 4 continuedTranslation exposureShareholders’ equity in foreign subsidiaries is normally not currency hedged, sinceit is regarded as an investment of a long-term nature. There may be exceptions,however. The translation difference in the shareholders’ equity of the Group may besignificant during certain periods of major exchange rate fluctuations. The largestexposures are in GBP, EUR and NOK.<strong>Skanska</strong> hedges the shareholders’ equity of its U.S. operations, due to itssignificant impact on the shareholders’ equity of the Group in case of exchange ratefluctuations. Investments in project development and BOT, which will be divestedafter completion, are normally financed through loans in functional or localcurrencies.See Note 33, “Effects of changes in foreign exchange rates.”Interest rate riskThe average interest refixing period for all interest-bearing liabilities was 1.1 (0.8)years, and average maturity amounted to 2.2 (2.4) years. The average interest ratefor all consolidated interest-bearing liabilities amounted to 4.62 (5.16) percent atyear-end. The share of borrowing in foreign currencies declined to 33 (48) percent.The average interest refixing period for all interest-bearing assets was 0.1 (0.2)years, and the average interest rate was 2.66 (2.78) percent at year-end. Of these,receivables in foreign currencies accounted for 49 (76) percent.Various forms of derivatives are used in order to adjust the interest refixing periodand average maturity, respectively. To achieve such adjustments, <strong>Skanska</strong> mainlyuses interest rate swaps and currency swaps.The <strong>Skanska</strong> Group’s portfolio of derivatives related to borrowing was distributedas follows on December 31, <strong>2003</strong>. The values stated do not include accrued interest.Table 5. Unreported gains and losses for derivatives related to borrowing.Amounts in SEK M 2004 2005 2006 Later TotalReceiving fixed rate 14.8 20.4 9.5 15.6 60.3Paying fixed rate –21.4 –59.8 –44.4 –45.1 –170.7Net amount –6.6 –39.4 –34.9 –29.5 –110.4The fair value of the borrowing portfolio, including derivatives related to borrowing,would change by about SEK 103 M in case of a change of market interest rates– over the entire yield curve – of one percentage point, given the same volume andinterest refixing period as on December 31, <strong>2003</strong>. The relative risk in case of aninterest refixing period of 1.5 years amounted to SEK 45 M.Credit and counterparty riskThe Group’s credit and counterparty risk can be divided into two main categories:1) financial credit and counterparty risk and 2) customer credit risk (credit risk inprojects and other business contracts).Financial credit and counterparty riskThis is a risk that the Group runs in its relations with financial counterparties inthe case of deposits of surplus funds, bank account balances and investments infinancial assets. Financial credit and counterparty risk is identified, managed andreported according to limits defined in the Financial Policy and risk instruction.<strong>Skanska</strong> has netting (ISDA) agreements with all the financial counterparties withwhich it enters into derivative contracts. These agreements reduce counterpartyrisk to some extent. <strong>Skanska</strong> endeavors to limit its exposure to a few financialcounterparties that must meet prime standard requirements (possess a ratingequivalent to an A at Standard & Poor’s or the equivalent rating at Moody’s).<strong>Skanska</strong>’s investments in privately financed infrastructure projects (BOT projects)consist of shares and/or subordinated loans in a project company created for thispurpose. In conjunction with the financing of BOT projects, in some cases <strong>Skanska</strong>may assume responsibility for bank guarantees, in the form of Parent Companyguarantees, for the purpose of ensuring financing on behalf of a third party duringa limited period.The total obligation is equivalent to the Group’s ownership stake in the projectcompany in the form of shareholders’ equity and/or subordinated debenture loanswhen fully invested. <strong>Skanska</strong>’s ownership in BOT project companies amounts to amaximum of 50 percent (lower voting power). The Group is thus exposed to the riskthat other co-owners cannot fulfill their contractual financial obligations to projectcompanies. The process that precedes an investment includes a due diligenceassessment of the financial stability of the other co-owners. To limit this exposure,as a rule the co-owners of BOT project companies issue reciprocal Parent Companyguarantees.In major construction projects (mainly infrastructure projects), <strong>Skanska</strong> can worktogether with other construction companies in joint ventures. These joint venturesassume various types of guarantees toward the customer and the institutions thatprovide financing during the construction period, including completion bonds. TheGroup is thus exposed to the risk that other parties cannot fulfill their contractualobligations. The process that precedes project tenders together with othercompanies in joint ventures includes a due diligence assessment of the financialstability of the other co-owners. To limit this exposure, as a rule the parties in eachjoint venture issue reciprocal Parent Company guarantees.For further information, see Note 32, “Contingent liabilities.”Accounts receivable credit risk<strong>Skanska</strong>’s credit risk with regard to accounts receivable from customers have ahigh degree of risk diversification, due to the large number of projects of varyingsizes and types with numerous different customer categories in a large number ofgeographic markets.According to its Financial Policy, <strong>Skanska</strong> shall endeavor to limit the number ofcredit counterparties to the smallest possible number and they shall always havethe highest creditworthiness. A business unit is not permitted to extend credit to acustomer, before the beginning of a project or after its end, without first receivingapproval from SFS.The portion of <strong>Skanska</strong>’s operations related to construction projects extends onlyvery limited credit, since projects are invoiced in advance as far as possible. In otheroperations, such as facilities management, the extension of credit is limited to thecustomary invoicing periods. To ensure a systematic and uniform assessment ofconstruction projects, <strong>Skanska</strong> uses its Operational Risk Assessment (ORA) modelthroughout the Group.Insurable risksAt <strong>Skanska</strong>, there are guidelines for how insurance questions are to be dealt with.The insurance subsidiary <strong>Skanska</strong> Försäkrings AB provides back-up assistance tobusiness units in their procurement of arranged insurance solutions. The overallinsurance risk is normally reinsured in the international reinsurance market.Note 5Business combinations (principles of consolidation)<strong>Skanska</strong>’s consolidated financial statements are prepared in compliance with RR 1,”Business combinations.” See ”Accounting and valuation principles,” Note 1.Acquisitions of Group companiesQuarter Ownership, PurchaseAcquisition of shares Country acquired percent price Investment<strong>2003</strong>MIAB Sweden Q1 100 30 30BFW United States Q3 100 159 –14Bayshore(buying out minority) United States Q4 100 55 55Banske Stavby Czech Republic Q4 76 48 22Others –2 –3Total, <strong>2003</strong> 290 902002Yeager United States Q3 2002 100 473 457Others 42 41Total, 2002 515 498All of the year’s acquired companies are being consolidated according to the purchasemethod of accounting. There are no plans to divest any portion of the businessesof the acquired companies. All companies were acquired in the Construction andServices business stream.<strong>Skanska</strong> <strong>Annual</strong> <strong>Report</strong> <strong>2003</strong> – Notes, including accounting and valuation principles 57


