The due dates of future minimum lease payments for noncancellable operatingleases were distributed as follows.Expenses, due dates <strong>2003</strong> 2002Within one year –136 –138Later than one year but within five years –437 –341Later than five years –723 –285Total –1,296 –764Of this amount, SEK 0 M (–3) was related to properties that were subleased. Leaserevenue in 2002 was less than SEK 1 M.B. <strong>Skanska</strong> as a lessorFinancial leases<strong>Skanska</strong> owns a property in Sweden that is leased to a customer under a financiallease. The present value of the claim related to future minimum lease payments isreported in the balance sheet as a financial fixed asset. On the balance sheet date,it amounted to<strong>2003</strong> 2002Gross investment in financial leases 22– unearned financial revenues –4Net investment in financial leases 18 0– Non-guaranteed residual value belonging to the lessor –2Present value of claim related to futureminimum lease payments 16 0The due dates of the gross investment and present value of future minimum leasepayments were distributed as follows:Present value ofclaim related toGross investment in future minimumfinancial leases lease paymentsRevenues, due dates <strong>2003</strong> 2002 <strong>2003</strong> 2002Within one year 3 3Later than one year but within five years 10 8Later than five years 9 522 0 16 0Reserves for doubtful receivables related to minimum lease payments amountedto SEK 0 M (0). The variable portion of lease payments included in <strong>2003</strong> incomeamounted to SEK 0 M (0).Operating leasesCommercial Project Development carries out <strong>Skanska</strong>’s operating lease business.These properties are reported as current assets in the balance sheet. For adescription of the Commercial Project Development business stream, see Note 3,”Segment reporting.”In <strong>2003</strong>, the Group’s variable leasing income related to operating leasesamounted to SEK 4 M (26). The <strong>2003</strong> amount consisted of sales-based rent forcommercial space.The due dates of future minimum lease payments for non-cancellable operatingleases were distributed as follows:Note 39Events after the balance sheet dateIn January 2004, <strong>Skanska</strong> announced decisions to divest some of the specializedcompanies in <strong>Skanska</strong> Sweden as well as portions of <strong>Skanska</strong> IT Solutions in <strong>Skanska</strong>Services, whose businesses are not considered part of the Group’s core operations.The divestment process is intended to take place during 2004 and 2005.The companies affected are <strong>Skanska</strong> Installation, Myresjöhus, Flexator andTemporent, the portion of <strong>Skanska</strong> Prefab that works with ground productsand <strong>Skanska</strong> Glasbyggarna plus the IT section and central staff units of <strong>Skanska</strong>IT Solutions. In <strong>2003</strong>, the net sales of the businesses included in the planneddivestments was SEK 3.6 billion. The capital employed totaled about SEK 1.1 billion.These businesses have a total of about 2,100 employees.The financial reports were signed on February 12, 2004 and will be submitted tothe <strong>Annual</strong> Shareholders’ Meeting of <strong>Skanska</strong> AB on March 30, 2004 for adoption.Note 40 Discontinuing operationsAs a consequence of its strategic plan, <strong>Skanska</strong> made decisions to discontinue orsell units in the Group. From the Group’s perspective, none of these comprisesan organizational unit as defined in RR 19, ”Discontinuing operations.” Certaininformation about discontinued operations and ongoing discontinuation efforts isprovided below.Businesses discontinued during <strong>2003</strong><strong>Skanska</strong>’s construction operations in Hungary, Latvia and Lithuania were sold duringthe year.The shareholding in the Norwegian steel and concrete element company ContigaA/S was sold during the year. Half ownership in Contiga was included in <strong>Skanska</strong>’sacquisition of Selmer in 2000. Contiga has had a large proportion of its sales inSweden, thereby overlapping with the operations of <strong>Skanska</strong> Prefab.After the approval of <strong>Skanska</strong>’s <strong>2003</strong> <strong>Annual</strong> Meeting, the American subsidiarySpectrum <strong>Skanska</strong>, specializing in residential project development, was sold to thecompany’s management. This reduced the capital employed in the <strong>Skanska</strong> Groupby about SEK 900 M. At year-end, the Group had an outstanding claim of SEK 125.6M on the buyers.The Group’s residential project development in Denmark also ceased at year-end<strong>2003</strong>.Meanwhile continued efforts are underway to discontinue or divest additionalbusinesses in small markets.Ongoing discontinuation effortsThe Group initiated the discontinuation of its project export company <strong>Skanska</strong>International Projects. This company’s business will gradually close as the unit’s nineongoing projects are completed. In <strong>2003</strong>, the net sales of <strong>Skanska</strong> InternationalProjects was SEK 1.2 billion, and its operations had a total of some 2,800 employees.The <strong>Skanska</strong> Group signed a letter of intent covering the sale of its majorityholding in its mining contracting business in South Africa, Canada and Australia toMurray & Roberts, a publicly listed leading South African construction company. Theplanned sale involves the Group’s 79.1 percent shareholding in the publicly listedThe Cementation Company (Africa) Ltd., the wholly owned subsidiaryCementation <strong>Skanska</strong> Canada Inc. and a start-up mining contracting operation inAustralia.Revenues, due dates <strong>2003</strong> 2002Within one year 873 1,409Later than one year but within five years 2,117 4,081Later than five years 655 2,037Total 3,645 7,527The book value of current-asset properties in Commercial Project Developmenttotaled SEK 9,249 M (12,610).84 Notes, including accounting and valuation principles – <strong>Skanska</strong> <strong>Annual</strong> <strong>Report</strong> <strong>2003</strong>
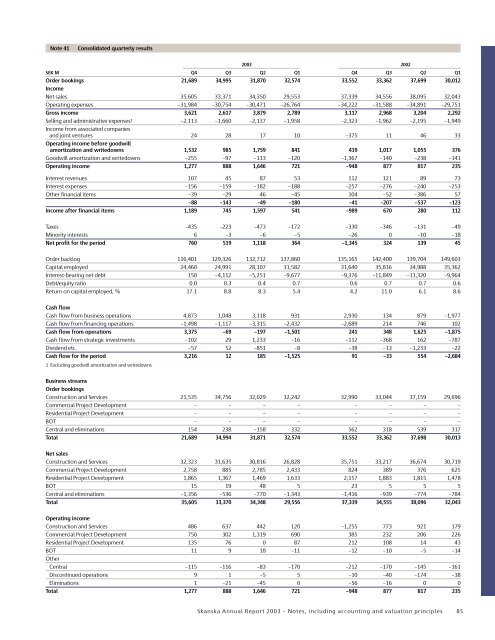
Note 41Consolidated quarterly results<strong>2003</strong> 2002SEK M Q4 Q3 Q2 Q1 Q4 Q3 Q2 Q1Order bookings 21,689 34,995 31,870 32,574 33,552 33,362 37,699 30,012IncomeNet sales 35,605 33,371 34,350 29,553 37,339 34,556 38,095 32,043Operating expenses –31,984 –30,754 –30,471 –26,764 –34,222 –31,588 –34,891 –29,751Gross income 3,621 2,617 3,879 2,789 3,117 2,968 3,204 2,292Selling and administrative expenses 1 –2,113 –1,660 –2,137 –1,958 –2,323 –1,962 –2,195 –1,949Income from associated companiesand joint ventures 24 28 17 10 –375 11 46 33Operating income before goodwillamortization and writedowns 1,532 985 1,759 841 419 1,017 1,055 376Goodwill amortization and writedowns –255 –97 –113 –120 –1,367 –140 –238 –141Operating income 1,277 888 1,646 721 –948 877 817 235Interest revenues 107 45 87 53 112 121 89 73Interest expenses –156 –159 –182 –188 –257 –276 –240 –253Other financial items –39 –29 46 –45 104 –52 –386 57–88 –143 –49 –180 –41 –207 –537 –123Income after financial items 1,189 745 1,597 541 –989 670 280 112Taxes –435 –223 –473 –172 –330 –346 –131 –49Minority interests 6 –3 –6 –5 –26 0 –10 –18Net profit for the period 760 519 1,118 364 –1,345 324 139 45Order backlog 116,401 129,326 132,712 137,860 135,165 142,400 139,704 149,603Capital employed 24,460 24,991 28,107 31,582 31,640 35,816 34,988 35,362Interest-bearing net debt 150 –4,112 –5,251 –9,677 –9,376 –11,849 –11,320 –9,964Debt/equity ratio 0.0 0.3 0.4 0.7 0.6 0.7 0.7 0.6Return on capital employed, % 17.1 8.8 8.3 5.4 4.2 11.0 6.1 8.6Cash flowCash flow from business operations 4,873 1,048 3,118 931 2,930 134 879 –1,977Cash flow from financing operations –1,498 –1,117 –3,315 –2,432 –2,689 214 746 102Cash flow from operations 3,375 –69 –197 –1,501 241 348 1,625 –1,875Cash flow from strategic investments –102 29 1,233 –16 –112 –368 162 –787Dividend etc. –57 52 –851 –8 –38 –13 –1,233 –22Cash flow for the period 3,216 12 185 –1,525 91 –33 554 –2,6841 Excluding goodwill amortization and writedownsBusiness streamsOrder bookingsConstruction and Services 21,535 34,756 32,029 32,242 32,990 33,044 37,159 29,696Commercial Project Development – – – – – – – –Residential Project Development – – – – – – – –BOT – – – – – – – –Central and eliminations 154 238 –158 332 562 318 539 317Total 21,689 34,994 31,871 32,574 33,552 33,362 37,698 30,013Net salesConstruction and Services 32,323 31,635 30,816 26,828 35,751 33,217 36,674 30,719Commercial Project Development 2,758 885 2,785 2,433 824 389 376 625Residential Project Development 1,865 1,367 1,469 1,633 2,157 1,883 1,815 1,478BOT 15 19 48 5 23 5 5 5Central and eliminations –1,356 –536 –770 –1,343 –1,416 –939 –774 –784Total 35,605 33,370 34,348 29,556 37,339 34,555 38,096 32,043Operating incomeConstruction and Services 486 637 442 120 –1,255 773 921 179Commercial Project Development 750 302 1,319 690 385 232 206 226Residential Project Development 135 76 0 87 212 108 14 43BOT 11 9 18 –11 –12 –10 –5 –14OtherCentral –115 –116 –83 –170 –212 –170 –145 –161Discontinued operations 9 1 –5 5 –10 –40 –174 –38Eliminations 1 –21 –45 0 –56 –16 0 0Total 1,277 888 1,646 721 –948 877 817 235<strong>Skanska</strong> <strong>Annual</strong> <strong>Report</strong> <strong>2003</strong> – Notes, including accounting and valuation principles 85