Note 3 continuedCommercial ResidentialConstruction Project Project Central and Groupand Services Development Development BOT eliminations total<strong>2003</strong> 2002 <strong>2003</strong> 2002 <strong>2003</strong> 2002 <strong>2003</strong> 2002 <strong>2003</strong> 2002 <strong>2003</strong> 2002Income statementExternal net sales 117,198 132,105 8,861 2,214 6,334 7,333 87 38 399 343 132,879 142,033Intra-Group net sales 4,404 4,256 0 0 0 0 0 0 –4,404 –4,256 0 0Total net sales 121,602 136,361 8,861 2,214 6,334 7,333 87 38 –4,005 –3,913 132,879 142,033Construction, manufacturing andproperty management expenses –112,957–126,918 –5,552 –906 –5,658 –6,506 –55 –61 4,249 3,939–119,973–130,452Gross income 8,645 9,443 3,309 1,308 676 827 32 –23 244 26 12,906 11,581Selling and administrative expenses 1 –6,468 –6,743 –244 –258 –366 –439 –57 –39 –733 –950 –7,868 –8,429Income from joint venturesand associated companies 86 –294 –4 –1 –5 –11 52 21 –50 0 79 –285Operating income before goodwillamortization and writedowns 2 2,263 2,406 3,061 1,049 305 377 27 –41 –539 –924 5,117 2,867Goodwill amortization/writedowns 3 –578 –1,788 0 0 –7 0 0 0 0 –98 –585 –1,886Operating income 1,685 618 3,061 1,049 298 377 27 –41 –539 –1,022 4,532 981Interest revenues 237 268 22 36 0 33 19 9 14 49 292 395Interest expenses –685 –1,026 –685 –1,026Other financial items –67 –277 –67 –277Income after financial items 1,922 886 3,083 1,085 298 410 46 –32 –1,277 –2,276 4,072 73Taxes –1,303 –856 –1,303 –856Minority interests –8 –54 –8 –54Net profit for the year 1,922 886 3,083 1,085 298 410 46 –32 –2,588 –3,186 2,761 –837AssetsIntangible fixed assets 4,304 5,320 0 0 8 30 387 399 19 92 4,718 5,841Tangible fixed assets 6,657 7,672 7 9 46 96 1 0 19 31 6,730 7,808Shares and participations in companiesreported according to the equity method 645 863 58 61 84 0 720 587 –133 –40 1,374 1,471Other shares and participations 94 0 5 5 14 118 0 0 –37 424 76 547Interest-bearing assets 4 5,044 5,753 218 218 351 656 114 76 4,514 1,046 10,241 7,749Current-asset properties 1,067 2,121 9,485 12,796 3,391 4,814 0 0 –249 –187 13,694 19,544Tax claims 1,954 1,931 1,954 1,931Operating receivables etc. 25,336 28,416 327 556 2,223 2,252 56 19 9 614 27,951 31,857Total assets 43,147 50,145 10,100 13,645 6,117 7,966 1,278 1,081 6,096 3,911 66,738 76,748LiabilitiesTax liabilities 3,675 2,765 3,675 2,765Other operating liabilities andnon-interest-bearing provisions 33,618 36,605 641 606 3,186 2,989 35 37 1,123 2,106 38,603 42,34333,618 36,605 641 606 3,186 2,989 35 37 4,798 4,871 42,278 45,108Capital employed 9,529 13,540 9,459 13,039 2,931 4,977 1,243 1,044 1,298 –960 24,460 31,640Cash flow from operations 5Cash flow operations before investments 3,665 3,554 884 606 110 883 –58 –38 –246 –728 4,355 4,277Net investments in business operations –394 –1,237 6,173 –894 811 708 –114 –579 34 –23 6,510 –2,025Cash flow effect, adjustment ofdates, net investments –54 –22 53 1,165 49 0 0 0 0 –1 48 1,142Taxes paid in business operations –943 –1,428 –943 –1,428Cash flow from business operations 3,217 2,295 7,110 877 970 1,591 –172 –617 –1,155 –2,180 9,970 1,966Net strategic investments 84 –474 0 1 0 –29 0 0 320 314 404 –188Taxes paid on strategic divestments 740 –917 740 –917Cash flow from strategic investments 84 –474 0 1 0 –29 0 0 1,060 –603 1,144 –1,105Cash flow before financing operations and dividend 3,301 1,821 7,110 878 970 1,562 –172 –617 –95 –2,783 11,114 861Net investmentsInvestments –1,849 –2,697 –1,399 –1,674 –3,773 –4,741 –115 –579 209 –4 –6,927 –9,695Divestments 1,539 986 7,572 781 4,584 5,420 1 0 145 295 13,841 7,482Net investments –310 –1,711 6,173 –893 811 679 –114 –579 354 291 6,914 –2,213Order bookings 120,562 132,889 0 0 0 0 0 0 566 1,736 121,128 134,625Order backlog 116,303 135,079 0 0 0 0 0 0 98 86 116,401 135,165Employees 68,209 70,656 149 177 824 1,320 32 24 455 521 69,669 72,6981 excluding goodwill amortization and writedowns2 of which, amortization –1,355 –1,607 –2 –2 –11 –11 0 –3 –9 –57 –1,377 –1,680of which, writedowns/reversals of writedowns –80 –308 0 –63 –25 –26 0 0 –2 0 –107 –397of which, gain on sale of residential units 0 0 0 0 583 675 0 0 –12 3 571 678of which, gain on sale of commercial properties 93 77 2,399 294 0 0 0 0 –21 1 2,471 3723 of which, luimp-sum writedown of goodwill 0 –1,131 0 0 0 0 0 0 0 0 0 –1,1314 including external cash and bank balances, excluding deposits in <strong>Skanska</strong>’s treasury unit.5 Taxes paid for the Group are included in the item Central and eliminations.52 Notes, including accounting and valuation principles – <strong>Skanska</strong> <strong>Annual</strong> <strong>Report</strong> <strong>2003</strong>
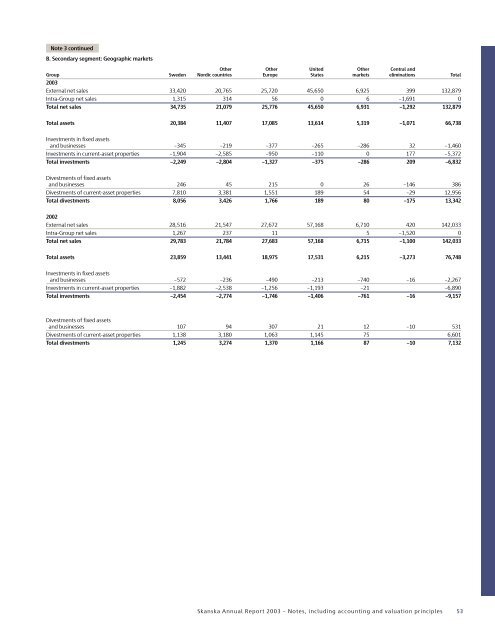
Note 3 continuedB. Secondary segment: Geographic marketsOther Other United Other Central andGroup Sweden Nordic countries Europe States markets eliminations Total<strong>2003</strong>External net sales 33,420 20,765 25,720 45,650 6,925 399 132,879Intra-Group net sales 1,315 314 56 0 6 –1,691 0Total net sales 34,735 21,079 25,776 45,650 6,931 –1,292 132,879Total assets 20,384 11,407 17,085 13,614 5,319 –1,071 66,738Investments in fixed assetsand businesses –345 –219 –377 –265 –286 32 –1,460Investments in current-asset properties –1,904 –2,585 –950 –110 0 177 –5,372Total investments –2,249 –2,804 –1,327 –375 –286 209 –6,832Divestments of fixed assetsand businesses 246 45 215 0 26 –146 386Divestments of current-asset properties 7,810 3,381 1,551 189 54 –29 12,956Total divestments 8,056 3,426 1,766 189 80 –175 13,3422002External net sales 28,516 21,547 27,672 57,168 6,710 420 142,033Intra-Group net sales 1,267 237 11 5 –1,520 0Total net sales 29,783 21,784 27,683 57,168 6,715 –1,100 142,033Total assets 23,859 13,441 18,975 17,531 6,215 –3,273 76,748Investments in fixed assetsand businesses –572 –236 –490 –213 –740 –16 –2,267Investments in current-asset properties –1,882 –2,538 –1,256 –1,193 –21 –6,890Total investments –2,454 –2,774 –1,746 –1,406 –761 –16 –9,157Divestments of fixed assetsand businesses 107 94 307 21 12 –10 531Divestments of current-asset properties 1,138 3,180 1,063 1,145 75 6,601Total divestments 1,245 3,274 1,370 1,166 87 –10 7,132<strong>Skanska</strong> <strong>Annual</strong> <strong>Report</strong> <strong>2003</strong> – Notes, including accounting and valuation principles 53