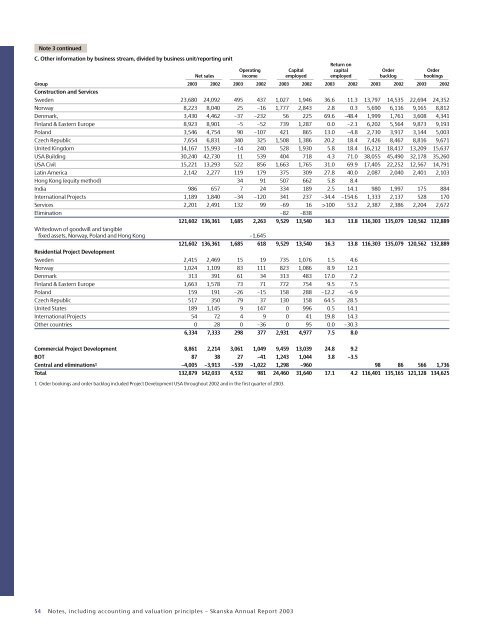
Note 3 continuedC. Other information by business stream, divided by business unit/reporting unitReturn onOperating Capital capital Order OrderNet sales income employed employed backlog bookingsGroup <strong>2003</strong> 2002 <strong>2003</strong> 2002 <strong>2003</strong> 2002 <strong>2003</strong> 2002 <strong>2003</strong> 2002 <strong>2003</strong> 2002Construction and ServicesSweden 23,680 24,092 495 437 1,027 1,946 36.6 11.3 13,797 14,535 22,694 24,352Norway 8,223 8,040 25 –16 1,777 2,843 2.8 0.3 5,690 6,116 9,165 8,812Denmark, 3,430 4,462 –37 –232 56 225 69.6 –48.4 1,999 1,761 3,608 4,341Finland & Eastern Europe 8,923 8,901 –5 –52 739 1,287 0.0 –2.1 6,202 5,564 9,873 9,193Poland 3,546 4,754 90 –107 421 865 13.0 –4.8 2,730 3,917 3,144 5,003Czech Republic 7,654 6,831 340 325 1,508 1,386 20.2 18.4 7,426 8,467 8,816 9,671United Kingdom 14,167 15,993 –14 240 528 1,930 5.8 18.4 16,212 18,417 13,209 15,637USA Building 30,240 42,730 11 539 404 718 4.3 71.0 38,055 45,490 32,178 35,260USA Civil 15,221 13,293 522 856 1,663 1,765 31.0 69.9 17,405 22,252 12,567 14,791Latin America 2,142 2,277 119 179 375 309 27.8 40.0 2,087 2,040 2,401 2,103Hong Kong (equity method) 34 91 507 662 5.8 8.4India 986 657 7 24 334 189 2.5 14.1 980 1,997 175 884International Projects 1,189 1,840 –34 –120 341 237 –34.4 –154.6 1,333 2,137 528 170Services 2,201 2,491 132 99 –69 16 >100 53.2 2,387 2,386 2,204 2,672Elimination –82 –838121,602 136,361 1,685 2,263 9,529 13,540 16.3 13.8 116,303 135,079 120,562 132,889Writedown of goodwill and tangiblefixed assets, Norway, Poland and Hong Kong –1,645121,602 136,361 1,685 618 9,529 13,540 16.3 13.8 116,303 135,079 120,562 132,889Residential Project DevelopmentSweden 2,415 2,469 15 19 735 1,076 1.5 4.6Norway 1,024 1,109 83 111 823 1,086 8.9 12.1Denmark 313 391 61 34 313 483 17.0 7.2Finland & Eastern Europe 1,663 1,578 73 71 772 754 9.5 7.5Poland 159 191 –26 –15 158 288 –12.2 –6.9Czech Republic 517 350 79 37 130 158 64.5 28.5United States 189 1,145 9 147 0 996 0.5 14.1International Projects 54 72 4 9 0 41 19.8 14.3Other countries 0 28 0 –36 0 95 0.0 –30.36,334 7,333 298 377 2,931 4,977 7.5 8.0Commercial Project Development 8,861 2,214 3,061 1,049 9,459 13,039 24.8 9.2BOT 87 38 27 –41 1,243 1,044 3.8 –3.5Central and eliminations 1 –4,005 –3,913 –539 –1,022 1,298 –960 98 86 566 1,736Total 132,879 142,033 4,532 981 24,460 31,640 17.1 4.2 116,401 135,165 121,128 134,6251 Order bookings and order backlog included Project Development USA throughout 2002 and in the first quarter of <strong>2003</strong>.54 Notes, including accounting and valuation principles – <strong>Skanska</strong> <strong>Annual</strong> <strong>Report</strong> <strong>2003</strong>
Note 4Financial instruments and financial risk management1. Objectives and policyFor <strong>Skanska</strong>, it is essential to ensure an effective and systematic assessment of bothfinancial and business risks. <strong>Skanska</strong>’s business risk management model does notimply avoidance of risks, but is instead aimed at identifying, managing and pricingthese risks.<strong>Skanska</strong>’s Board of Directors is responsible for establishing the Group’s FinancialPolicy, which states guidelines, objectives and limits for financial management andadministration of financial risks in the Group. This policy document regulates theallocation of responsibilities among <strong>Skanska</strong>’s Board, the Senior Executive Team,<strong>Skanska</strong> Financial Services (SFS) and the business units. Within the Group, SFS hasoperative responsibility for ensuring Group financing and efficiently managingliquidity, financial assets and liabilities. SFS is also responsible for monitoringcompliance with the Financial Policy. The Senior Executive Team, through the ChiefFinancial Officer, is responsible for reporting risk exposure as well as gains/lossesfrom the Group’s financial activities to <strong>Skanska</strong>’s Board.2. Financial risksGeneralFinancial risks can mainly be divided into the following categories: interest rate,foreign exchange, refinancing and credit risk.Interest rate riskThe Financial Policy states that the target for the Group’s interest-rate refixingperiod shall be 1.5 years ± 1 year. This is achieved mainly by entering into swapagreements to adjust the characteristics of the borrowing portfolio so that thetarget can be achieved.Interest rate risk is defined as the possible negative impact in case of a sudden onepercentage point increase in interest rates across all maturities. Relative risk in caseof deviations in interest-rate refixing period may not exceed SEK 100 M.Refinancing riskRefinancing risk is defined as the risk caused by lack of liquidity or difficulty inobtaining, or rolling over, external loans.In compliance with the Financial Policy, the maturity of the Group’s borrowingshall be 3 years ± 1 year. The Group shall also have the equivalent of at least SEK4,000 M in available liquid assets or committed credit facilities at all times, accessiblewithin the space of one week.Foreign exchange riskAlthough <strong>Skanska</strong> has a large international presence, its operations are of a localnature in terms of foreign exchange risks. Project revenues and costs are mainlydenominated in the same currency, and transaction risks from exchanges betweendifferent currencies are thus very limited. Foreign exchange risk is defined as the riskof negative impact on the Group’s earnings due to fluctuations in exchange rates.This risk can be divided into transaction exposure, i.e. net operating (export/import) and financial (interest/principal payment) flows, and translation exposurerelated to the shareholders’ equity of foreign subsidiaries denominated in foreigncurrencies.The objective stated in the Financial Policy is that all transaction exposures foreach respective business unit shall be hedged via SFS. This foreign exchange riskmay amount to a total of SEK 50 M, with risk calculated as the effect on earningsof a five percentage point shift in exchange rates. The foreign exchange risk intransaction exposure is kept as close to zero as possible.The foreign exchange risk that arises because portions of the shareholders’ equityof the Group are invested long-term in foreign subsidiaries, known as translationexposure, is not hedged. Exceptions to this rule are the shareholders’ equity of U.S.operations and some British subsidiaries, plus investments in project developmentand BOT. In the two latter cases, the investment is normally financed through loansin functional or local currencies.Credit riskCredit and counterpart risk is defined as the risk that the Group will suffer a lossbecause a counterparty does not fulfill its contractual commitments toward<strong>Skanska</strong>. Financial credit and counterparty risk is identified, managed and reportedaccording to limits defined in the Financial Policy and risk instruction.According to the Financial Policy, <strong>Skanska</strong> shall endeavor to limit the numberof counterparties to as few as possible, and they shall always be of the bestcreditworthiness.To ensure a systematic and uniform assessment of construction projects, <strong>Skanska</strong>uses its Operational Risk Assessment (ORA) model throughout the Group.3. ValuationValuation methods for financial instrumentsFinancial assets and liabilities are normally reported at acquisition value. Financialliabilities whose acquisition value differs from nominal value are reported ataccrued acquisition value, with premiums or discounts accrued (on a straight-linebasis) over their life.Receivables and liabilities in foreign currencies are translated at the exchange rateprevailing on the balance sheet date, in compliance with recommendation RR 8 ofthe Swedish Financial Accounting Standards Council.<strong>Skanska</strong> uses currency forward contracts, foreign currency loans and currencyswaps to hedge against fluctuations in exchange rates.Unrealized gains and losses on forward contracts related to hedging of operativetransaction exposure are included in the reporting of each respective project,according to its degree of completion.Loans in foreign currencies and currency derivatives for hedging of translationexposure are valued at the exchange rate prevailing on the balance sheet date.Exchange rate differences are reported, taking into consideration the tax effect,against the shareholders’ equity of the Group. Any forward contract premium isaccrued over the period of the contract and reported as interest revenue or interestexpense.Interest rate derivatives (mainly interest rate swaps, FRA’s and futures) are usedfor hedging against changes in interest rates. These instruments are not reported atmarket value in the balance sheet. Income that arises is accrued over the period ofthe contract and reported as interest revenue or interest expense.<strong>Report</strong>ed and fair valueGross and net debt including provisionsThe Group’s net assets amounted to SEK 150 M. In 2002, the Group reported a netdebt of SEK 9,376 M.The Group’s net interest items before taking into account capitalized interestamounted to SEK –477 M (–775). The change was mainly attributable to a majorshift in the relationship between interest-bearing assets and liabilities, as well aslower interest rates in several of <strong>Skanska</strong>’s home markets.At the end of <strong>2003</strong>, the <strong>Skanska</strong> Group had an interest-bearing gross debt ofSEK 10,091 M (17,125). The Group’s interest-bearing assets rose to SEK 10,241 M(7,749).The table below shows reported and fair values of interest-bearing financialinstruments.Table 1a. <strong>Report</strong>ed value and fair value of interest-bearing financial instruments,<strong>Skanska</strong> GroupOn Dec. 31, <strong>2003</strong><strong>Report</strong>edFairSEK M value valueFinancial fixed assets 1,956 1,956Current receivables 1,248 1,248Short-term investments 218 218Cash and bank balances 6,819 6,819Derivatives related to transaction exposure 15Assets 10,241 10,256Bond loans 5,774 5,839Liabilities to credit institutions 1,664 1,660Other liabilities 552 550Derivatives related to borrowing 110Derivatives related to transaction exposure 30Provisions for pensions 1,926 1,638Other provisions 175 175Liabilities 10,091 10,002Less: Provisions for pensions –1,926 –1,638Liabilities excluding provisions for pensions 8,165 8,364<strong>Skanska</strong> <strong>Annual</strong> <strong>Report</strong> <strong>2003</strong> – Notes, including accounting and valuation principles 55