FY 2012 - Investor Relations - NIS
FY 2012 - Investor Relations - NIS
FY 2012 - Investor Relations - NIS

You also want an ePaper? Increase the reach of your titles
YUMPU automatically turns print PDFs into web optimized ePapers that Google loves.
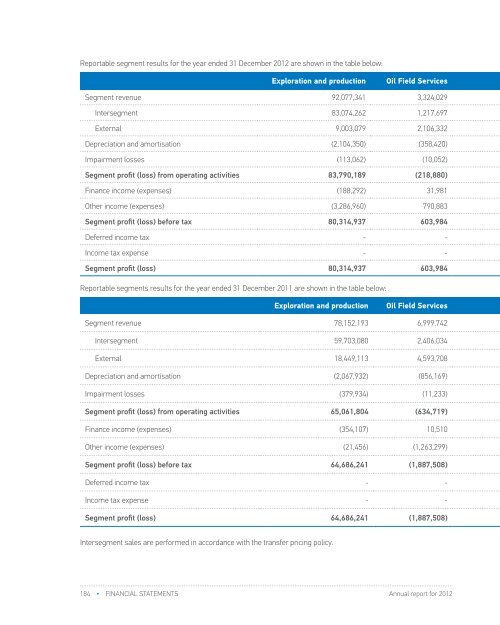
Reportable segment results for the year ended 31 December <strong>2012</strong> are shown in the table below:Exploration and production Oil Field Services Refining Trade Other Eliminations TotalSegment revenue 92,077,341 3,324,029 155,584,039 204,314,212 17,017,464 (242,246,261) 230,070,824Intersegment 83,074,262 1,217,697 154,020,794 1,108,024 2,825,484 (242,246,261) -External 9,003,079 2,106,332 1,563,245 203,206,188 14,191,980 - 230,070,824Depreciation and amortisation (2,104,350) (358,420) (1,950,957) (808,683) (1,051,381) - (6,273,791)Impairment losses (113,062) (10,052) (64,127) (110,965) (29,291) - (327,497)Segment profit (loss) from operating activities 83,790,189 (218,880) (9,096,463) 559,171 (10,053,260) - 64,980,757Finance income (expenses) (188,292) 31,981 (761,856) 560,413 (5,302,137) - (5,659,891)Other income (expenses) (3,286,960) 790,883 166,657 (283,157) (5,383,330) - (7,995,907)Segment profit (loss) before tax 80,314,937 603,984 (9,691,662) 836,427 (20,738,727) - 51,324,959Deferred income tax - - - - 707,442 - 707,442Income tax expense - - - - (2,575,885) - (2,575,885)Segment profit (loss) 80,314,937 603,984 (9,691,662) 836,427 (22,607,170) - 49,456,516Reportable segments results for the year ended 31 December 2011 are shown in the table below:Exploration and production Oil Field Services Refining Trade Other Eliminations TotalSegment revenue 78,152,193 6,999,742 136,362,877 168,759,386 199,310 (198,045,295) 192,428,213Intersegment 59,703,080 2,406,034 135,633,379 302,802 - (198,045,295) -External 18,449,113 4,593,708 729,498 168,456,584 199,310 - 192,428,213Depreciation and amortisation (2,067,932) (856,169) (2,023,125) (783,725) (924,714) - (6,655,665)Impairment losses (379,934) (11,233) (26,397) (105,766) (32,458) - (555,788)Segment profit (loss) from operating activities 65,061,804 (634,719) (15,478,960) (943,658) (6,935,281) - 41,069,186Finance income (expenses) (354,107) 10,510 (318,367) 402,740 (1,565,349) - (1,824,573)Other income (expenses) (21,456) (1,263,299) (1,728,714) 3,063,357 402,873 - 452,761Segment profit (loss) before tax 64,686,241 (1,887,508) (17,526,041) 2,522,439 (8,097,757) - 39,697,374Deferred income tax - - - - 3,368,556 - 3,368,556Income tax expense - - - - (2,464,263) - (2,464,263)Segment profit (loss) 64,686,241 (1,887,508) (17,526,041) 2,522,439 (7,193,464) - 40,601,667Intersegment sales are performed in accordance with the transfer pricing policy.184 • FINANCIAL STATEMENTS Annual report for <strong>2012</strong>Annual report for <strong>2012</strong>FINANCIAL STATEMENTS • 185