FY 2012 - Investor Relations - NIS
FY 2012 - Investor Relations - NIS
FY 2012 - Investor Relations - NIS
Create successful ePaper yourself
Turn your PDF publications into a flip-book with our unique Google optimized e-Paper software.
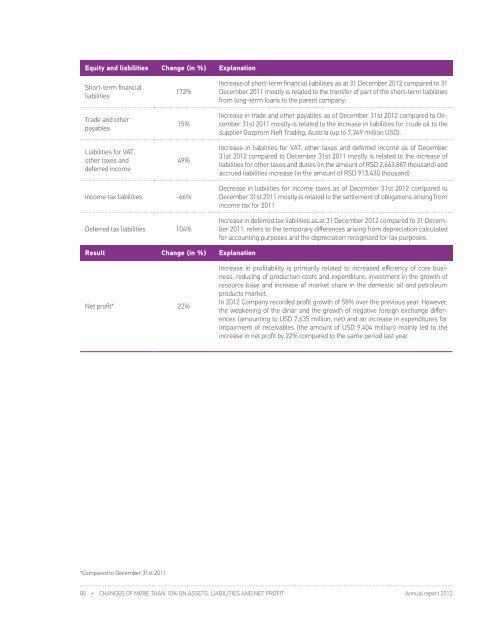
Equity and liabilities Change (in %) ExplanationShort-term financialliabilities172%Increase of short-term financial liabilities as at 31 December <strong>2012</strong> compared to 31December 2011 mostly is related to the transfer of part of the short-term liabilitiesfrom long-term loans to the parent company.Major Byers and SuppliersTrade and otherpayables15%Increase in trade and other payables as of December 31st <strong>2012</strong> compared to December31st 2011 mostly is related to the increase in liabilities for crude oil to thesupplier Gazprom Neft Trading, Austria (up to 7,349 million USD).Liabilities for VAT,other taxes anddeferred income49%Income tax liabilities -66%Deferred tax liabilities 104%Result Change (in %) ExplanationNet profit* 22%Increase in liabilities for VAT, other taxes and deferred income as of December31st <strong>2012</strong> compared to December 31st 2011 mostly is related to the increase ofliabilities for other taxes and duties (in the amount of RSD 2,663,887 thousand) andaccrued liabilities increase (in the amount of RSD 913,430 thousand)Decrease in liabilities for income taxes as of December 31st <strong>2012</strong> compared toDecember 31st 2011 mostly is related to the settlement of obligations arising fromincome tax for 2011Increase in deferred tax liabilities as at 31 December <strong>2012</strong> compared to 31 December2011. refers to the temporary differences arising from depreciation calculatedfor accounting purposes and the depreciation recognized for tax purposes.Increase in profitability is primarily related to increased efficiency of core business,reducing of production costs and expenditure, investment in the growth ofresource base and increase of market share in the domestic oil and petroleumproducts market.In <strong>2012</strong> Company recorded profit growth of 58% over the previous year. However,the weakening of the dinar and the growth of negative foreign exchange differences(amounting to USD 7,635 million, net) and an increase in expenditures forimpairment of receivables (the amount of USD 9,404 million) mainly led to theincrease in net profit by 22% compared to the same period last year.Byers Turnover in millions RSD 1 Share in total incomeKnez Petrol d.o.o. 23,662 9%Srbijagas Novi Sad 19,385 7%OMV Serbia d.o.o. 16,248 6%Petrobart d.o.o. 11,502 4%Total: 70,797 26%Other byers 199,156 74%Total: 269,953 100%From January 1 st – December 31 st <strong>2012</strong>SuppliersTotal debt in mln. RSD*Share in the total liabilities tosuppliersGazprom Neft Trading Gmbh 25,465 73%HIP Petrohemija 562 2%Srbijagas Novi Sad 554 2%ELPETRA ENERGY S.A. 386 1%Total: 26,967 77%Other byers 8,071 23%Total: 35,038 100%* as of December 31 st <strong>2012</strong>Major ByersMajor suppliers74%9%7%23%73%6%4%1%2%2%Knez Petrol.OMV SerbiaOthersSrbijagasPetrobartHIP PetrohemijaGazprom Neft Trading GmbhОthersGlencore Energy UK LtdSrbijagas*Compared to December 31st 201180 • Changes of more than 10% on assets, liabilities and net profit Annual report <strong>2012</strong>Annual report <strong>2012</strong>Major Byers and Suppliers • 81


