FY 2012 - Investor Relations - NIS
FY 2012 - Investor Relations - NIS
FY 2012 - Investor Relations - NIS

Create successful ePaper yourself
Turn your PDF publications into a flip-book with our unique Google optimized e-Paper software.
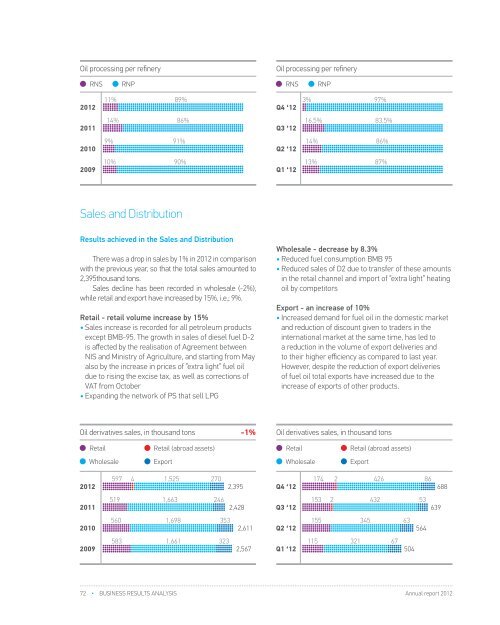
Oil processing per refineryOil processing per refineryRetail – abroad assets, in thousand tons 100%RNSRNPRNSRNPRetail<strong>2012</strong>11%89%Q4 ‘123%97%<strong>2012</strong>42011201014%9%86%91%Q3 ‘12Q2 ‘1216.5%14%83.5%86%20110200910%90%Q1 ‘1213%87%Sales and DistributionSales structure per oil derivatives,in thousand tonsBlack and other productsWhite products-1%Sales structure per oil derivatives,in thousand tonsBlack and other productsWhite productsResults achieved in the Sales and DistributionThere was a drop in sales by 1% in <strong>2012</strong> in comparisonwith the previous year, so that the total sales amounted to2,395thousand tons.Sales decline has been recorded in wholesale (-2%),while retail and export have increased by 15%, i.e.; 9%.Retail - retail volume increase by 15%• Sales increase is recorded for all petroleum productsexcept BMB-95. The growth in sales of diesel fuel D-2is affected by the realisation of Agreement between<strong>NIS</strong> and Ministry of Agriculture, and starting from Mayalso by the increase in prices of ”extra light” fuel oildue to rising the excise tax, as well as corrections ofVAT from October• Expanding the network of PS that sell LPGOil derivatives sales, in thousand tons -1%RetailWholesaleRetail (abroad assets)Export597 4 1,525 270<strong>2012</strong> 2,3955191,663 2462011 2,4285601,6983532010 2,6115831,661 3232009 2,567Wholesale - decrease by 8.3%• Reduced fuel consumption BMB 95• Reduced sales of D2 due to transfer of these amountsin the retail channel and import of ”extra light” heatingoil by competitorsExport - an increase of 10%• Increased demand for fuel oil in the domestic marketand reduction of discount given to traders in theinternational market at the same time, has led toa reduction in the volume of export deliveries andto their higher efficiency as compared to last year.However, despite the reduction of export deliveriesof fuel oil total exports have increased due to theincrease of exports of other products.Oil derivatives sales, in thousand tonsRetailWholesaleRetail (abroad assets)Export174 2426 86Q4 ‘12 688153 2432 53Q3 ‘12 63915534563Q2 ‘12 564115321 67Q1 ‘12 504<strong>2012</strong>201120106807017861,7151,7271,8252,3952,4282,6119311,6362009 2,567Q4 ‘12Q3 ‘12Q2 ‘12164136221428476467159345Q1 ‘12 504Number of petrol stations 2010 2011 <strong>2012</strong>Operational petrol stations* 465 399 338Reconstructed petrol stations 7 10 9New petrol stations 1 2 1New LPG facilities 11 28 11Petrol stations on lease 0 69 82* as of December 31st excluding LPG retail points (cylinders shops, loading stations). Number of operational petrol stations for <strong>2012</strong> includes 4 internalpetrol stations and does not 58 closed petrol stations.Number of petrol station in the region564639688<strong>2012</strong>Romania Bulgaria B&HOperational petrol stations 1 14 6Reconstructed petrol stations 1 - 4New petrol stations - - 2New LPG facilities - - -Petrol stations on lease - - -72 • Business results analysis Annual report <strong>2012</strong>Annual report <strong>2012</strong>Business results analysis • 73