FY 2012 - Investor Relations - NIS
FY 2012 - Investor Relations - NIS
FY 2012 - Investor Relations - NIS

Create successful ePaper yourself
Turn your PDF publications into a flip-book with our unique Google optimized e-Paper software.
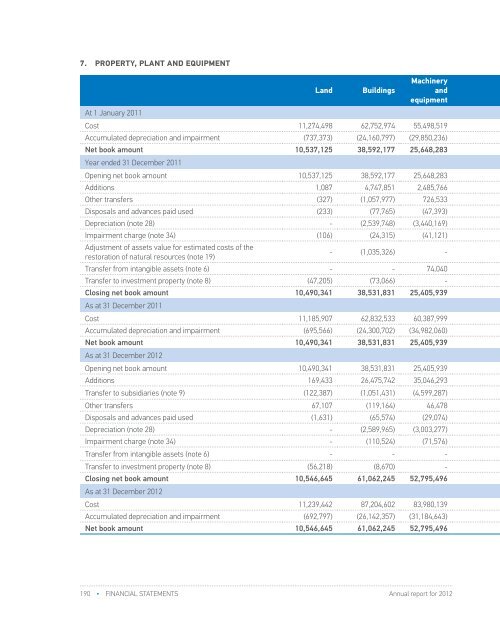
7. PROPERTY, PLANT AND EQUIPMENTLandBuildingsMachineryandequipmentConstruction inprogressOther PP&EInvestments inleased PP&EAdvances tosuppliersAt 1 January 2011Cost 11,274,498 62,752,974 55,498,519 13,801,387 89,938 110,630 12,787,121 156,315,067Accumulated depreciation and impairment (737,373) (24,160,797) (29,850,236) (3,366,233) (1,426) (109,910) (74,701) (58,300,676)Net book amount 10,537,125 38,592,177 25,648,283 10,435,154 88,512 720 12,712,420 98,014,391Year ended 31 December 2011Opening net book amount 10,537,125 38,592,177 25,648,283 10,435,154 88,512 720 12,712,420 98,014,391Additions 1,087 4,747,851 2,485,766 31,239,335 6,986 - 14,627,610 53,108,635Other transfers (327) (1,057,977) 726,533 306,068 - - - (25,703)Disposals and advances paid used (233) (77,765) (47,393) (67,634) (2,738) - (18,591,128) (18,786,891)Depreciation (note 28) - (2,539,748) (3,440,169) - - (360) - (5,980,277)Impairment charge (note 34) (106) (24,315) (41,121) (255,528) (4,501) - - (325,571)Adjustment of assets value for estimated costs of therestoration of natural resources (note 19)- (1,035,326) - - - - - (1,035,326)Transfer from intangible assets (note 6) - - 74,040 - - - - 74,040Transfer to investment property (note 8) (47,205) (73,066) - - - - - (120,271)Closing net book amount 10,490,341 38,531,831 25,405,939 41,657,395 88,259 360 8,748,902 124,923,027As at 31 December 2011Cost 11,185,907 62,832,533 60,387,999 44,639,338 93,279 110,630 8,770,320 188,020,006Accumulated depreciation and impairment (695,566) (24,300,702) (34,982,060) (2,981,943) (5,020) (110,270) (21,418) (63,096,979)Net book amount 10,490,341 38,531,831 25,405,939 41,657,395 88,259 360 8,748,902 124,923,027As at 31 December <strong>2012</strong>Opening net book amount 10,490,341 38,531,831 25,405,939 41,657,395 88,259 360 8,748,902 124,923,027Additions 169,433 26,475,742 35,046,293 (21,277,999) 351 - 5,801,412 46,215,232Transfer to subsidiaries (note 9) (122,387) (1,051,431) (4,599,287) - (12,243) - - (5,785,348)Other transfers 67,107 (119,164) 46,478 - - - - (5,579)Disposals and advances paid used (1,631) (65,574) (29,074) (659,597) (722) - (12,145,685) (12,902,283)Depreciation (note 28) - (2,589,965) (3,003,277) - - (360) - (5,593,602)Impairment charge (note 34) - (110,524) (71,576) (39,924) (607) - - (222,631)Transfer from intangible assets (note 6) - - - (2,044,888) - - - (2,044,888)Transfer to investment property (note 8) (56,218) (8,670) - - - - - (64,888)Closing net book amount 10,546,645 61,062,245 52,795,496 17,634,987 75,038 - 2,404,629 144,519,040As at 31 December <strong>2012</strong>Cost 11,239,442 87,204,602 83,980,139 22,573,044 76,173 110,630 2,426,047 207,610,077Accumulated depreciation and impairment (692,797) (26,142,357) (31,184,643) (4,938,057) (1,135) (110,630) (21,418) (63,091,037)Net book amount 10,546,645 61,062,245 52,795,496 17,634,987 75,038 - 2,404,629 144,519,040Total190 • FINANCIAL STATEMENTS Annual report for <strong>2012</strong>Annual report for <strong>2012</strong>FINANCIAL STATEMENTS • 191