FY 2012 - Investor Relations - NIS
FY 2012 - Investor Relations - NIS
FY 2012 - Investor Relations - NIS
You also want an ePaper? Increase the reach of your titles
YUMPU automatically turns print PDFs into web optimized ePapers that Google loves.
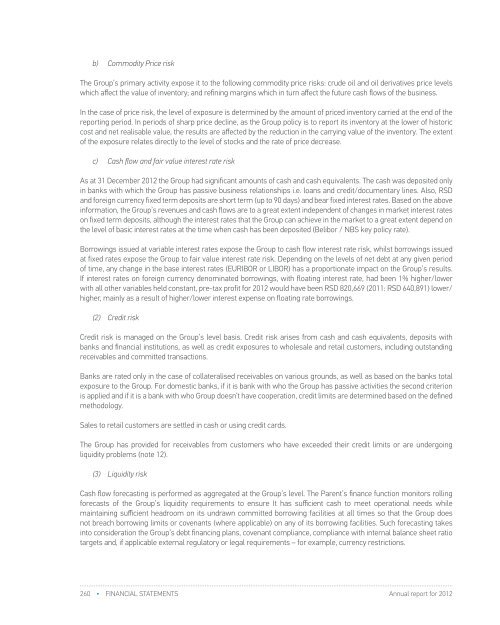
) Commodity Price riskThe Group’s primary activity expose it to the following commodity price risks: crude oil and oil derivatives price levelswhich affect the value of inventory; and refining margins which in turn affect the future cash flows of the business.In the case of price risk, the level of exposure is determined by the amount of priced inventory carried at the end of thereporting period. In periods of sharp price decline, as the Group policy is to report its inventory at the lower of historiccost and net realisable value, the results are affected by the reduction in the carrying value of the inventory. The extentof the exposure relates directly to the level of stocks and the rate of price decrease.c) Cash flow and fair value interest rate riskAs at 31 December <strong>2012</strong> the Group had significant amounts of cash and cash equivalents. The cash was deposited onlyin banks with which the Group has passive business relationships i.e. loans and credit/documentary lines. Also, RSDand foreign currency fixed term deposits are short term (up to 90 days) and bear fixed interest rates. Based on the aboveinformation, the Group’s revenues and cash flows are to a great extent independent of changes in market interest rateson fixed term deposits, although the interest rates that the Group can achieve in the market to a great extent depend onthe level of basic interest rates at the time when cash has been deposited (Belibor / NBS key policy rate).Borrowings issued at variable interest rates expose the Group to cash flow interest rate risk, whilst borrowings issuedat fixed rates expose the Group to fair value interest rate risk. Depending on the levels of net debt at any given periodof time, any change in the base interest rates (EURIBOR or LIBOR) has a proportionate impact on the Group’s results.If interest rates on foreign currency denominated borrowings, with floating interest rate, had been 1% higher/lowerwith all other variables held constant, pre-tax profit for <strong>2012</strong> would have been RSD 820,669 (2011: RSD 640,891) lower/higher, mainly as a result of higher/lower interest expense on floating rate borrowings.(2) Credit riskCredit risk is managed on the Group’s level basis. Credit risk arises from cash and cash equivalents, deposits withbanks and financial institutions, as well as credit exposures to wholesale and retail customers, including outstandingreceivables and committed transactions.Banks are rated only in the case of collateralised receivables on various grounds, as well as based on the banks totalexposure to the Group. For domestic banks, if it is bank with who the Group has passive activities the second criterionis applied and if it is a bank with who Group doesn’t have cooperation, credit limits are determined based on the definedmethodology.Sales to retail customers are settled in cash or using credit cards.The Group has provided for receivables from customers who have exceeded their credit limits or are undergoingliquidity problems (note 12).(3) Liquidity riskCash flow forecasting is performed as aggregated at the Group’s level. The Parent’s finance function monitors rollingforecasts of the Group’s liquidity requirements to ensure It has sufficient cash to meet operational needs whilemaintaining sufficient headroom on its undrawn committed borrowing facilities at all times so that the Group doesnot breach borrowing limits or covenants (where applicable) on any of its borrowing facilities. Such forecasting takesinto consideration the Group’s debt financing plans, covenant compliance, compliance with internal balance sheet ratiotargets and, if applicable external regulatory or legal requirements – for example, currency restrictions.Surplus cash over and above balance required for working capital management is invested as surplus cash in timedeposits.The table below analyses the Group’s financial liabilities into relevant maturity groupings based on the remaining periodat the reporting date to the contractual maturity date.The amounts disclosed in the table are the contractual undiscounted cash flows. Balances due within 12 months equaltheir carrying balances as the impact of discounting is not significant.As at 31 December<strong>2012</strong>Borrowings and otherlong term and shortterm financial liabilities(long-term and currentportion)Liabilities from businessoperationsOther short-termliabilitiesAccrued expenses anddeferred revenueAs at 31 December2011Borrowings and otherlong term and shortterm financial liabilities(long-term and currentportion)Liabilities from businessoperationsOther short-termliabilitiesAccrued expenses anddeferred revenueLess than1 month1 - 3months3 months- 1 year1 - 5yearsOver 5yearsTotal4,281 1,413,061 7,943,224 45,780,957 35,601,645 90,743,16815,859,713 17,279,162 227,334 - 10 33,366,2196,051,982 75,277 835,097 - - 6,962,3562,359,137 22,426 1,792,862 - - 4,174,42524,275,113 18,789,926 10,798,517 45,780,957 35,601,655 135,246,168Less than1 month1 - 3months3 months- 1 year1 - 5yearsOver 5yearsTotal760,201 157,555 3,098,980 45,258,966 36,222,560 85,498,26211,087,784 9,484,179 9,049,974 - - 29,621,9376,690,255 1,402 3,041 - - 6,694,6982,693,884 - - - - 2,693,88421,232,124 9,643,136 12,151,995 45,258,966 36,222,560 124,508,781260 • FINANCIAL STATEMENTS Annual report for <strong>2012</strong>Annual report for <strong>2012</strong>FINANCIAL STATEMENTS • 261


