FY 2012 - Investor Relations - NIS
FY 2012 - Investor Relations - NIS
FY 2012 - Investor Relations - NIS

Create successful ePaper yourself
Turn your PDF publications into a flip-book with our unique Google optimized e-Paper software.
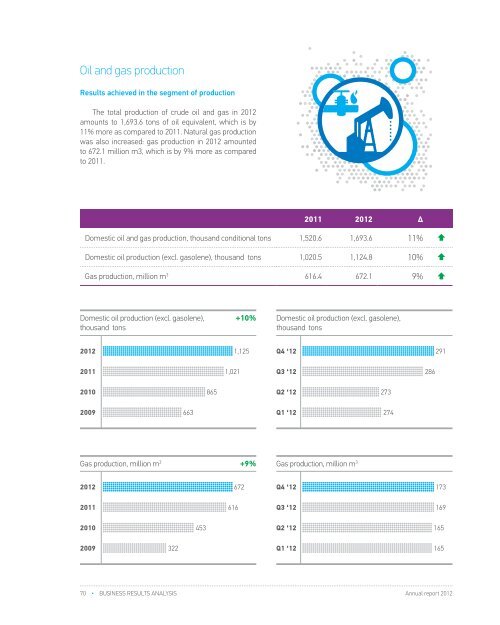
Oil and gas productionOil production dynamics, thou. tons/dayGas production dynamics, million m3/dayResults achieved in the segment of production2011 <strong>2012</strong> 2011<strong>2012</strong>The total production of crude oil and gas in <strong>2012</strong>amounts to 1,693.6 tons of oil equivalent, which is by11% more as compared to 2011. Natural gas productionwas also increased: gas production in <strong>2012</strong> amountedto 672.1 million m3, which is by 9% more as comparedto 2011.1.93.0 1.71.52.5 1.3I II III IV V VI VII VIII IX X XI XIIIIIIIIVVVIVIIVIIIIXXXIXIDomestic oil production (excl. gasolene),thousand tons<strong>2012</strong> 1,1252011 1,0212010 865+10%2011 <strong>2012</strong> ΔDomestic oil and gas production, thousand conditional tons 1,520.6 1,693.6 11%Domestic oil production (excl. gasolene), thousand tons 1,020.5 1,124.8 10%Gas production, million m 3 616.4 672.1 9%Domestic oil production (excl. gasolene),thousand tonsQ4 ‘12 291Q3 ‘12 286Q2 ‘12 273RefiningResults achieved in the refining segmentIn <strong>2012</strong>, there was a drop in refining volume by 9% incomparison with the previous year: 2,142 thou. tons wererefined in <strong>2012</strong>, as opposed to 2,359 thou. tons in 2011.• Planned overhauls of Pancevo Refinery wererealized in following periods:• February 22nd – April 2nd <strong>2012</strong>• June 21st – July 16th <strong>2012</strong>• August 30th – October 2nd <strong>2012</strong>• Finalizing and testing before commissioning newMHC/DHT facility in Pancevo Refinery• Refining in <strong>2012</strong> is in line with operational plansformed according to market demand for oil andoil derivatives which is also reason for decrease inrefining2009 663Q1 ‘12 274Oil processing including third parties, in thousand tons -9%Oil processing including third parties, in thousand tonsImported crudeDomestic crudeImported crudeDomestic crudeGas production, million m 3 +9%Gas production, million m 3Crude oil toll services for third parties<strong>2012</strong> 672Q4 ‘12 1731,028 1,114<strong>2012</strong> 2,142336346Q4 ‘12 6822011 616Q3 ‘12 1691,3669932011 2,359151 190Q3 ‘12 3412010 453Q2 ‘12 1651,960890 72010 2,857307399Q2 ‘12 7062009 322Q1 ‘12 1651,993628 2512009 2,872234 179Q1 ‘12 41370 • Business results analysis Annual report <strong>2012</strong>Annual report <strong>2012</strong>Business results analysis • 71