FY 2012 - Investor Relations - NIS
FY 2012 - Investor Relations - NIS
FY 2012 - Investor Relations - NIS

Create successful ePaper yourself
Turn your PDF publications into a flip-book with our unique Google optimized e-Paper software.
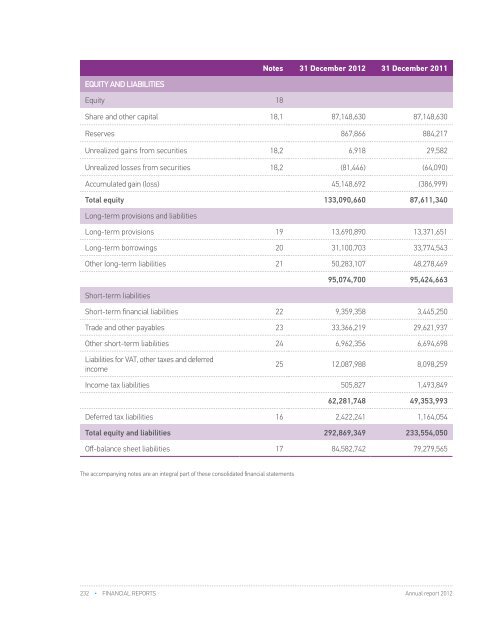
Notes 31 December <strong>2012</strong> 31 December 2011Consolidated Income StatementEQUITY AND LIABILITIESEquity 18Share and other capital 18,1 87,148,630 87,148,630Reserves 867,866 884,217Unrealized gains from securities 18,2 6,918 29,582Unrealized losses from securities 18,2 (81,446) (64,090)Аccumulated gain (loss) 45,148,692 (386,999)Total equity 133,090,660 87,611,340Long-term provisions and liabilitiesLong-term provisions 19 13,690,890 13,371,651Long-term borrowings 20 31,100,703 33,774,543Other long-term liabilities 21 50,283,107 48,278,469Short-term liabilities95,074,700 95,424,663Short-term financial liabilities 22 9,359,358 3,445,250Trade and other payables 23 33,366,219 29,621,937Other short-term liabilities 24 6,962,356 6,694,698Liabilities for VAT, other taxes and deferredincome25 12,087,988 8,098,259Income tax liabilities 505,827 1,493,84962,281,748 49,353,993Deferred tax liabilities 16 2,422,241 1,164,054Total equity and liabilities 292,869,349 233,554,050Off-balance sheet liabilities 17 84,582,742 79,279,565The accompanying notes are an integral part of these consolidated financial statementsOperating incomeYear ended 31 DecemberNotes <strong>2012</strong> 2011Sales 5 226,605,585 187,069,899Work performed by the entity and capitalized 5,614,382 4,511,530Increase in inventories of finished goods andwork in progress1,664,825 768,451Other operating income 26 198,683 300,309Operating expenses234,083,475 192,650,189Cost of goods sold (26,621,606) (12,711,852)Raw material and consumables used 27 (91,646,458) (95,575,854)Employee benefits expense 29 (24,922,733) (21,987,012)Depreciation, amortisation and provision 28 (9,212,485) (6,854,507)Other operating expenses 30 (18,311,703) (14,793,918)(170,714,985) (151,923,143)Operating profit 63,368,490 40,727,046Finance income 31 9,964,434 7,014,939Finance expenses 32 (15,974,288) (8,838,821)Other income 33 4,759,628 7,823,562Other expenses 34 (14,648,732) (7,009,260)Profit before income tax 47,469,532 39,717,466Income tax expenseCurrent income tax expense 35 (2,591,542) (2,466,758)Deferred income tax benefit 16 654,621 3,365,056Profit for the year 45,532,611 40,615,764Net loss attributable to non-controllinginterests18 (19,734) (22,006)Net profit attributable to owners of parent 18 45,552,345 40,637,770Earnings per share- Basic 36 0.279 0.249The accompanying notes are an integral part of these consolidated financial statements.232 • Financial reports Annual report <strong>2012</strong>Annual report <strong>2012</strong>Financial reports • 233