FY 2012 - Investor Relations - NIS
FY 2012 - Investor Relations - NIS
FY 2012 - Investor Relations - NIS

Create successful ePaper yourself
Turn your PDF publications into a flip-book with our unique Google optimized e-Paper software.
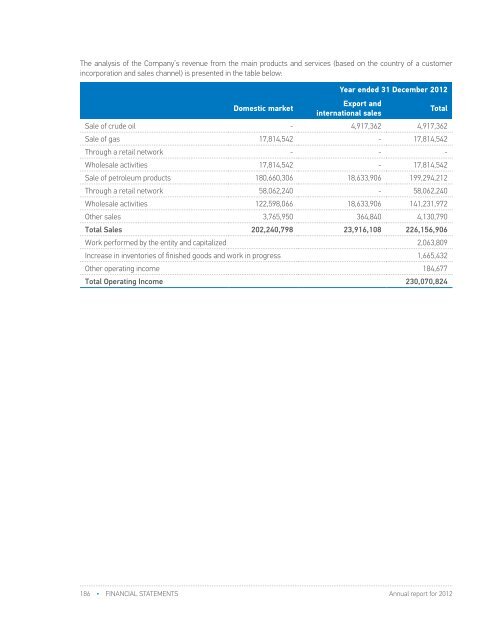
The analysis of the Company’s revenue from the main products and services (based on the country of a customerincorporation and sales channel) is presented in the table below:Year ended 31 December <strong>2012</strong>Domestic marketExport andinternational salesTotalSale of crude oil - 4,917,362 4,917,362Sale of gas 17,814,542 - 17,814,542Through a retail network - - -Wholesale activities 17,814,542 - 17,814,542Sale of petroleum products 180,660,306 18,633,906 199,294,212Through a retail network 58,062,240 - 58,062,240Wholesale activities 122,598,066 18,633,906 141,231,972Other sales 3,765,950 364,840 4,130,790Total Sales 202,240,798 23,916,108 226,156,906Work performed by the entity and capitalized 2,063,809Increase in inventories of finished goods and work in progress 1,665,432Other operating income 184,677Total Operating Income 230,070,824Year ended 31 December 2011Domestic marketExport andinternational salesTotalSale of crude oil - 4,685,664 4,685,664Sale of gas 13,288,107 - 13,288,107Through a retail network - - -Wholesale activities 13,288,107 - 13,288,107Sale of petroleum products 151,222,962 14,315,844 165,538,806Through a retail network 43,193,966 - 43,193,966Wholesale activities 108,028,996 14,315,844 122,344,840Other sales 2,550,277 820,104 3,370,381Total Sales 167,061,346 19,821,612 186,882,958Work performed by the entity and capitalized 4,478,663Increase in inventories of finished goods and work in progress 768,451Other operating income 298,141Total Operating Income 192,428,213186 • FINANCIAL STATEMENTS Annual report for <strong>2012</strong>Annual report for <strong>2012</strong>FINANCIAL STATEMENTS • 187