6 5 - RR DONNELLEY FINANCIAL - External Home Login
6 5 - RR DONNELLEY FINANCIAL - External Home Login
6 5 - RR DONNELLEY FINANCIAL - External Home Login
Create successful ePaper yourself
Turn your PDF publications into a flip-book with our unique Google optimized e-Paper software.
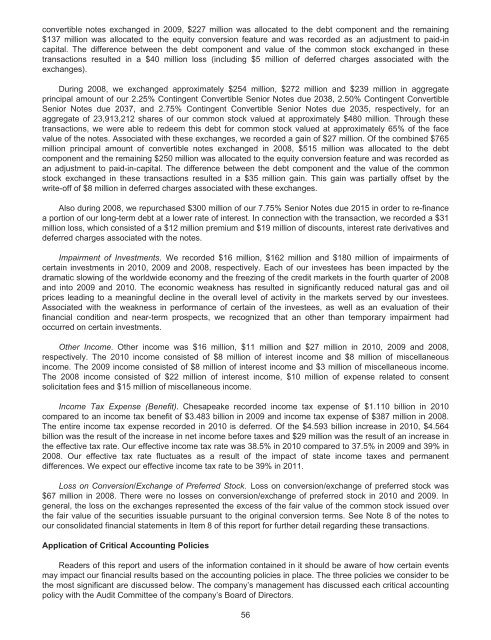
convertible notes exchanged in 2009, $227 million was allocated to the debt component and the remaining<br />
$137 million was allocated to the equity conversion feature and was recorded as an adjustment to paid-in<br />
capital. The difference between the debt component and value of the common stock exchanged in these<br />
transactions resulted in a $40 million loss (including $5 million of deferred charges associated with the<br />
exchanges).<br />
During 2008, we exchanged approximately $254 million, $272 million and $239 million in aggregate<br />
principal amount of our 2.25% Contingent Convertible Senior Notes due 2038, 2.50% Contingent Convertible<br />
Senior Notes due 2037, and 2.75% Contingent Convertible Senior Notes due 2035, respectively, for an<br />
aggregate of 23,913,212 shares of our common stock valued at approximately $480 million. Through these<br />
transactions, we were able to redeem this debt for common stock valued at approximately 65% of the face<br />
value of the notes. Associated with these exchanges, we recorded a gain of $27 million. Of the combined $765<br />
million principal amount of convertible notes exchanged in 2008, $515 million was allocated to the debt<br />
component and the remaining $250 million was allocated to the equity conversion feature and was recorded as<br />
an adjustment to paid-in-capital. The difference between the debt component and the value of the common<br />
stock exchanged in these transactions resulted in a $35 million gain. This gain was partially offset by the<br />
write-off of $8 million in deferred charges associated with these exchanges.<br />
Also during 2008, we repurchased $300 million of our 7.75% Senior Notes due 2015 in order to re-finance<br />
a portion of our long-term debt at a lower rate of interest. In connection with the transaction, we recorded a $31<br />
million loss, which consisted of a $12 million premium and $19 million of discounts, interest rate derivatives and<br />
deferred charges associated with the notes.<br />
Impairment of Investments. We recorded $16 million, $162 million and $180 million of impairments of<br />
certain investments in 2010, 2009 and 2008, respectively. Each of our investees has been impacted by the<br />
dramatic slowing of the worldwide economy and the freezing of the credit markets in the fourth quarter of 2008<br />
and into 2009 and 2010. The economic weakness has resulted in significantly reduced natural gas and oil<br />
prices leading to a meaningful decline in the overall level of activity in the markets served by our investees.<br />
Associated with the weakness in performance of certain of the investees, as well as an evaluation of their<br />
financial condition and near-term prospects, we recognized that an other than temporary impairment had<br />
occurred on certain investments.<br />
Other Income. Other income was $16 million, $11 million and $27 million in 2010, 2009 and 2008,<br />
respectively. The 2010 income consisted of $8 million of interest income and $8 million of miscellaneous<br />
income. The 2009 income consisted of $8 million of interest income and $3 million of miscellaneous income.<br />
The 2008 income consisted of $22 million of interest income, $10 million of expense related to consent<br />
solicitation fees and $15 million of miscellaneous income.<br />
Income Tax Expense (Benefit). Chesapeake recorded income tax expense of $1.110 billion in 2010<br />
compared to an income tax benefit of $3.483 billion in 2009 and income tax expense of $387 million in 2008.<br />
The entire income tax expense recorded in 2010 is deferred. Of the $4.593 billion increase in 2010, $4.564<br />
billion was the result of the increase in net income before taxes and $29 million was the result of an increase in<br />
the effective tax rate. Our effective income tax rate was 38.5% in 2010 compared to 37.5% in 2009 and 39% in<br />
2008. Our effective tax rate fluctuates as a result of the impact of state income taxes and permanent<br />
differences. We expect our effective income tax rate to be 39% in 2011.<br />
Loss on Conversion/Exchange of Preferred Stock. Loss on conversion/exchange of preferred stock was<br />
$67 million in 2008. There were no losses on conversion/exchange of preferred stock in 2010 and 2009. In<br />
general, the loss on the exchanges represented the excess of the fair value of the common stock issued over<br />
the fair value of the securities issuable pursuant to the original conversion terms. See Note 8 of the notes to<br />
our consolidated financial statements in Item 8 of this report for further detail regarding these transactions.<br />
Application of Critical Accounting Policies<br />
Readers of this report and users of the information contained in it should be aware of how certain events<br />
may impact our financial results based on the accounting policies in place. The three policies we consider to be<br />
the most significant are discussed below. The company’s management has discussed each critical accounting<br />
policy with the Audit Committee of the company’s Board of Directors.<br />
56


