6 5 - RR DONNELLEY FINANCIAL - External Home Login
6 5 - RR DONNELLEY FINANCIAL - External Home Login
6 5 - RR DONNELLEY FINANCIAL - External Home Login

Create successful ePaper yourself
Turn your PDF publications into a flip-book with our unique Google optimized e-Paper software.
For 2010, we realized an average price per mcf of natural gas of $5.57, compared to $5.93 in 2009 and<br />
$8.09 in 2008 (weighted average prices for all years discussed exclude the effect of unrealized gains or losses<br />
on derivatives). Included in the 2010 realized price of natural gas are gains related to swaps that had an abovemarket<br />
fixed price on the origination date. We obtained these above-market swaps by selling out-year call<br />
options on a portion of our projected natural gas and oil production. See Item 7A for a complete listing of all of<br />
our derivative instruments. Oil prices realized per barrel (excluding unrealized gains or losses on derivatives)<br />
were $62.71, $58.38 and $70.48 in 2010, 2009 and 2008, respectively. Realized gains or losses from our<br />
natural gas and oil derivatives resulted in a net increase in natural gas and oil revenues of $2.056 billion, or<br />
$1.99 per mcfe, in 2010, a net increase of $2.346 billion, or $2.59 per mcfe, in 2009 and a net decrease of $8<br />
million, or $0.01 per mcfe, in 2008.<br />
A change in natural gas and oil prices has a significant impact on our natural gas and oil revenues and<br />
cash flows. Assuming 2010 production levels, an increase or decrease of $0.10 per mcf of natural gas sold<br />
would result in an increase or decrease in 2010 revenues and cash flows of approximately $92 million and $89<br />
million, respectively, and an increase or decrease of $1.00 per barrel of oil sold would result in an increase or<br />
decrease in 2010 revenues and cash flows of approximately $18 million and $17 million, respectively, without<br />
considering the effect of hedging activities.<br />
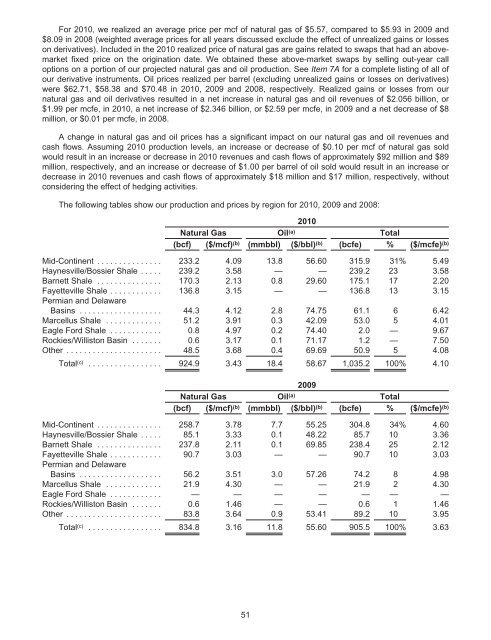
The following tables show our production and prices by region for 2010, 2009 and 2008:<br />
2010<br />
Natural Gas Oil (a) Total<br />
(bcf) ($/mcf) (b) (mmbbl) ($/bbl) (b) (bcfe) % ($/mcfe) (b)<br />
Mid-Continent ............... 233.2 4.09 13.8 56.60 315.9 31% 5.49<br />
Haynesville/Bossier Shale ..... 239.2 3.58 — — 239.2 23 3.58<br />
Barnett Shale ............... 170.3 2.13 0.8 29.60 175.1 17 2.20<br />
Fayetteville Shale ............ 136.8 3.15 — — 136.8 13 3.15<br />
Permian and Delaware<br />
Basins ................... 44.3 4.12 2.8 74.75 61.1 6 6.42<br />
Marcellus Shale ............. 51.2 3.91 0.3 42.09 53.0 5 4.01<br />
Eagle Ford Shale ............ 0.8 4.97 0.2 74.40 2.0 — 9.67<br />
Rockies/Williston Basin ....... 0.6 3.17 0.1 71.17 1.2 — 7.50<br />
Other ...................... 48.5 3.68 0.4 69.69 50.9 5 4.08<br />
Total (c) ................. 924.9 3.43 18.4 58.67 1,035.2 100% 4.10<br />
2009<br />
Natural Gas Oil (a) Total<br />
(bcf) ($/mcf) (b) (mmbbl) ($/bbl) (b) (bcfe) % ($/mcfe) (b)<br />
Mid-Continent ............... 258.7 3.78 7.7 55.25 304.8 34% 4.60<br />
Haynesville/Bossier Shale ..... 85.1 3.33 0.1 48.22 85.7 10 3.36<br />
Barnett Shale ............... 237.8 2.11 0.1 69.85 238.4 25 2.12<br />
Fayetteville Shale ............ 90.7 3.03 — — 90.7 10 3.03<br />
Permian and Delaware<br />
Basins ................... 56.2 3.51 3.0 57.26 74.2 8 4.98<br />
Marcellus Shale ............. 21.9 4.30 — — 21.9 2 4.30<br />
Eagle Ford Shale ............ — — — — — — —<br />
Rockies/Williston Basin ....... 0.6 1.46 — — 0.6 1 1.46<br />
Other ...................... 83.8 3.64 0.9 53.41 89.2 10 3.95<br />
Total (c) ................. 834.8 3.16 11.8 55.60 905.5 100% 3.63<br />
51