6 5 - RR DONNELLEY FINANCIAL - External Home Login
6 5 - RR DONNELLEY FINANCIAL - External Home Login
6 5 - RR DONNELLEY FINANCIAL - External Home Login

Create successful ePaper yourself
Turn your PDF publications into a flip-book with our unique Google optimized e-Paper software.
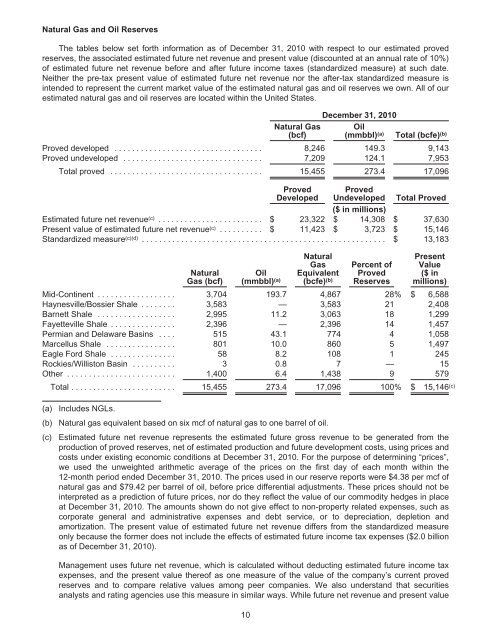
Natural Gas and Oil Reserves<br />
The tables below set forth information as of December 31, 2010 with respect to our estimated proved<br />
reserves, the associated estimated future net revenue and present value (discounted at an annual rate of 10%)<br />
of estimated future net revenue before and after future income taxes (standardized measure) at such date.<br />
Neither the pre-tax present value of estimated future net revenue nor the after-tax standardized measure is<br />
intended to represent the current market value of the estimated natural gas and oil reserves we own. All of our<br />
estimated natural gas and oil reserves are located within the United States.<br />
Natural Gas<br />
(bcf)<br />
December 31, 2010<br />
Oil<br />
(mmbbl) (a) Total (bcfe) (b)<br />
Proved developed .................................. 8,246 149.3 9,143<br />
Proved undeveloped ................................ 7,209 124.1 7,953<br />
Total proved ................................... 15,455 273.4 17,096<br />
Proved<br />
Developed<br />
Proved<br />
Undeveloped Total Proved<br />
($ in millions)<br />
Estimated future net revenue (c) ........................ $ 23,322 $ 14,308 $ 37,630<br />
Present value of estimated future net revenue (c) .......... $ 11,423 $ 3,723 $ 15,146<br />
Standardized measure (c)(d) ........................................................ $ 13,183<br />
Natural<br />
Gas (bcf)<br />
Oil<br />
(mmbbl) (a)<br />
Natural<br />
Gas<br />
Equivalent<br />
(bcfe) (b)<br />
Percent of<br />
Proved<br />
Reserves<br />
Present<br />
Value<br />
($ in<br />
millions)<br />
Mid-Continent .................. 3,704 193.7 4,867 28% $ 6,588<br />
Haynesville/Bossier Shale ........ 3,583 — 3,583 21 2,408<br />
Barnett Shale .................. 2,995 11.2 3,063 18 1,299<br />
Fayetteville Shale ............... 2,396 — 2,396 14 1,457<br />
Permian and Delaware Basins .... 515 43.1 774 4 1,058<br />
Marcellus Shale ................ 801 10.0 860 5 1,497<br />
Eagle Ford Shale ............... 58 8.2 108 1 245<br />
Rockies/Williston Basin .......... 3 0.8 7 — 15<br />
Other ......................... 1,400 6.4 1,438 9 579<br />
Total ........................ 15,455 273.4 17,096 100% $ 15,146 (c)<br />
(a) Includes NGLs.<br />
(b) Natural gas equivalent based on six mcf of natural gas to one barrel of oil.<br />
(c) Estimated future net revenue represents the estimated future gross revenue to be generated from the<br />
production of proved reserves, net of estimated production and future development costs, using prices and<br />
costs under existing economic conditions at December 31, 2010. For the purpose of determining “prices”,<br />
we used the unweighted arithmetic average of the prices on the first day of each month within the<br />
12-month period ended December 31, 2010. The prices used in our reserve reports were $4.38 per mcf of<br />
natural gas and $79.42 per barrel of oil, before price differential adjustments. These prices should not be<br />
interpreted as a prediction of future prices, nor do they reflect the value of our commodity hedges in place<br />
at December 31, 2010. The amounts shown do not give effect to non-property related expenses, such as<br />
corporate general and administrative expenses and debt service, or to depreciation, depletion and<br />
amortization. The present value of estimated future net revenue differs from the standardized measure<br />
only because the former does not include the effects of estimated future income tax expenses ($2.0 billion<br />
as of December 31, 2010).<br />
Management uses future net revenue, which is calculated without deducting estimated future income tax<br />
expenses, and the present value thereof as one measure of the value of the company’s current proved<br />
reserves and to compare relative values among peer companies. We also understand that securities<br />
analysts and rating agencies use this measure in similar ways. While future net revenue and present value<br />
10