6 5 - RR DONNELLEY FINANCIAL - External Home Login
6 5 - RR DONNELLEY FINANCIAL - External Home Login
6 5 - RR DONNELLEY FINANCIAL - External Home Login
Create successful ePaper yourself
Turn your PDF publications into a flip-book with our unique Google optimized e-Paper software.
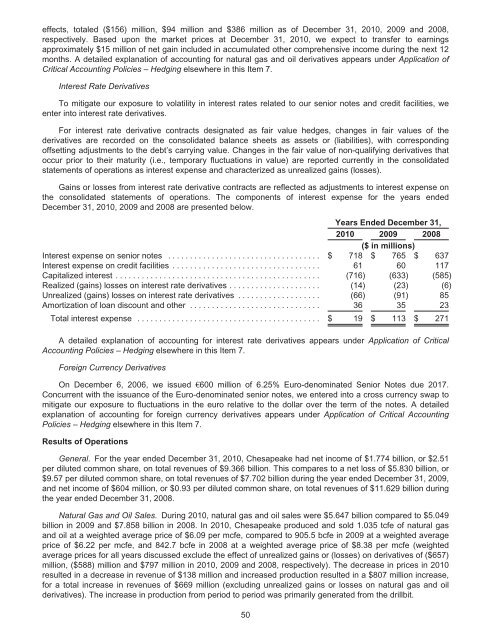
effects, totaled ($156) million, $94 million and $386 million as of December 31, 2010, 2009 and 2008,<br />
respectively. Based upon the market prices at December 31, 2010, we expect to transfer to earnings<br />
approximately $15 million of net gain included in accumulated other comprehensive income during the next 12<br />
months. A detailed explanation of accounting for natural gas and oil derivatives appears under Application of<br />
Critical Accounting Policies – Hedging elsewhere in this Item 7.<br />
Interest Rate Derivatives<br />
To mitigate our exposure to volatility in interest rates related to our senior notes and credit facilities, we<br />
enter into interest rate derivatives.<br />
For interest rate derivative contracts designated as fair value hedges, changes in fair values of the<br />
derivatives are recorded on the consolidated balance sheets as assets or (liabilities), with corresponding<br />
offsetting adjustments to the debt’s carrying value. Changes in the fair value of non-qualifying derivatives that<br />
occur prior to their maturity (i.e., temporary fluctuations in value) are reported currently in the consolidated<br />
statements of operations as interest expense and characterized as unrealized gains (losses).<br />
Gains or losses from interest rate derivative contracts are reflected as adjustments to interest expense on<br />
the consolidated statements of operations. The components of interest expense for the years ended<br />
December 31, 2010, 2009 and 2008 are presented below.<br />
Years Ended December 31,<br />
2010 2009 2008<br />
($ in millions)<br />
Interest expense on senior notes ................................... $ 718 $ 765 $ 637<br />
Interest expense on credit facilities .................................. 61 60 117<br />
Capitalized interest ............................................... (716) (633) (585)<br />
Realized (gains) losses on interest rate derivatives ..................... (14) (23) (6)<br />
Unrealized (gains) losses on interest rate derivatives ................... (66) (91) 85<br />
Amortization of loan discount and other .............................. 36 35 23<br />
Total interest expense .......................................... $ 19 $ 113 $ 271<br />
A detailed explanation of accounting for interest rate derivatives appears under Application of Critical<br />
Accounting Policies – Hedging elsewhere in this Item 7.<br />
Foreign Currency Derivatives<br />
On December 6, 2006, we issued €600 million of 6.25% Euro-denominated Senior Notes due 2017.<br />
Concurrent with the issuance of the Euro-denominated senior notes, we entered into a cross currency swap to<br />
mitigate our exposure to fluctuations in the euro relative to the dollar over the term of the notes. A detailed<br />
explanation of accounting for foreign currency derivatives appears under Application of Critical Accounting<br />
Policies – Hedging elsewhere in this Item 7.<br />
Results of Operations<br />
General. For the year ended December 31, 2010, Chesapeake had net income of $1.774 billion, or $2.51<br />
per diluted common share, on total revenues of $9.366 billion. This compares to a net loss of $5.830 billion, or<br />
$9.57 per diluted common share, on total revenues of $7.702 billion during the year ended December 31, 2009,<br />
and net income of $604 million, or $0.93 per diluted common share, on total revenues of $11.629 billion during<br />
the year ended December 31, 2008.<br />
Natural Gas and Oil Sales. During 2010, natural gas and oil sales were $5.647 billion compared to $5.049<br />
billion in 2009 and $7.858 billion in 2008. In 2010, Chesapeake produced and sold 1.035 tcfe of natural gas<br />
and oil at a weighted average price of $6.09 per mcfe, compared to 905.5 bcfe in 2009 at a weighted average<br />
price of $6.22 per mcfe, and 842.7 bcfe in 2008 at a weighted average price of $8.38 per mcfe (weighted<br />
average prices for all years discussed exclude the effect of unrealized gains or (losses) on derivatives of ($657)<br />
million, ($588) million and $797 million in 2010, 2009 and 2008, respectively). The decrease in prices in 2010<br />
resulted in a decrease in revenue of $138 million and increased production resulted in a $807 million increase,<br />
for a total increase in revenues of $669 million (excluding unrealized gains or losses on natural gas and oil<br />
derivatives). The increase in production from period to period was primarily generated from the drillbit.<br />
50


