6 5 - RR DONNELLEY FINANCIAL - External Home Login
6 5 - RR DONNELLEY FINANCIAL - External Home Login
6 5 - RR DONNELLEY FINANCIAL - External Home Login
You also want an ePaper? Increase the reach of your titles
YUMPU automatically turns print PDFs into web optimized ePapers that Google loves.
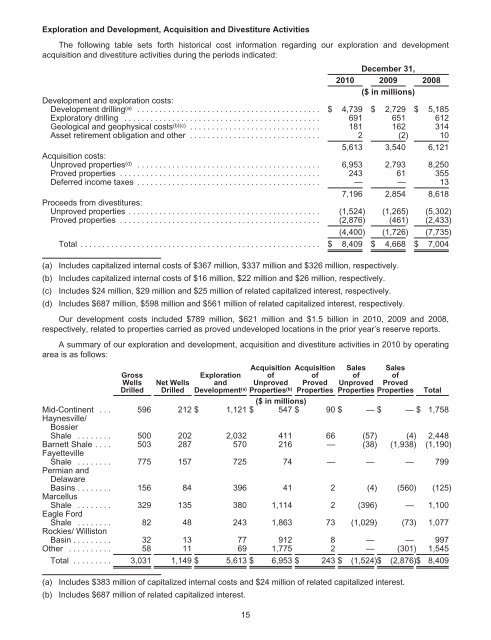
Exploration and Development, Acquisition and Divestiture Activities<br />
The following table sets forth historical cost information regarding our exploration and development<br />
acquisition and divestiture activities during the periods indicated:<br />
December 31,<br />
2010 2009<br />
($ in millions)<br />
2008<br />
Development and exploration costs:<br />
Development drilling (a) .......................................... $ 4,739 $ 2,729 $ 5,185<br />
Exploratory drilling ............................................. 691 651 612<br />
Geological and geophysical costs (b)(c) .............................. 181 162 314<br />
Asset retirement obligation and other .............................. 2 (2) 10<br />
Acquisition costs:<br />
5,613 3,540 6,121<br />
Unproved properties (d) .......................................... 6,953 2,793 8,250<br />
Proved properties .............................................. 243 61 355<br />
Deferred income taxes .......................................... — — 13<br />
Proceeds from divestitures:<br />
7,196 2,854 8,618<br />
Unproved properties ............................................ (1,524) (1,265) (5,302)<br />
Proved properties .............................................. (2,876) (461) (2,433)<br />
(4,400) (1,726) (7,735)<br />
Total ....................................................... $ 8,409 $ 4,668 $ 7,004<br />
(a) Includes capitalized internal costs of $367 million, $337 million and $326 million, respectively.<br />
(b) Includes capitalized internal costs of $16 million, $22 million and $26 million, respectively.<br />
(c) Includes $24 million, $29 million and $25 million of related capitalized interest, respectively.<br />
(d) Includes $687 million, $598 million and $561 million of related capitalized interest, respectively.<br />
Our development costs included $789 million, $621 million and $1.5 billion in 2010, 2009 and 2008,<br />
respectively, related to properties carried as proved undeveloped locations in the prior year’s reserve reports.<br />
A summary of our exploration and development, acquisition and divestiture activities in 2010 by operating<br />
area is as follows:<br />
Gross<br />
Wells<br />
Drilled<br />
Net Wells<br />
Drilled<br />
Exploration<br />
and<br />
Development (a)<br />
Acquisition<br />
of<br />
Unproved<br />
Properties (b)<br />
Acquisition<br />
of<br />
Proved<br />
Properties<br />
Sales<br />
of<br />
Unproved<br />
Properties<br />
Sales<br />
of<br />
Proved<br />
Properties Total<br />
($ in millions)<br />
Mid-Continent . . . 596 212 $ 1,121 $ 547 $ 90 $ — $ — $ 1,758<br />
Haynesville/<br />
Bossier<br />
Shale ........ 500 202 2,032 411 66 (57) (4) 2,448<br />
Barnett Shale .... 503 287 570 216 — (38) (1,938) (1,190)<br />
Fayetteville<br />
Shale ........ 775 157 725 74 — — — 799<br />
Permian and<br />
Delaware<br />
Basins ........ 156 84 396 41 2 (4) (560) (125)<br />
Marcellus<br />
Shale ........ 329 135 380 1,114 2 (396) — 1,100<br />
Eagle Ford<br />
Shale ........ 82 48 243 1,863 73 (1,029) (73) 1,077<br />
Rockies/ Williston<br />
Basin ......... 32 13 77 912 8 — — 997<br />
Other .......... 58 11 69 1,775 2 — (301) 1,545<br />
Total ......... 3,031 1,149 $ 5,613 $ 6,953 $ 243 $ (1,524)$ (2,876)$ 8,409<br />
(a) Includes $383 million of capitalized internal costs and $24 million of related capitalized interest.<br />
(b) Includes $687 million of related capitalized interest.<br />
15


