6 5 - RR DONNELLEY FINANCIAL - External Home Login
6 5 - RR DONNELLEY FINANCIAL - External Home Login
6 5 - RR DONNELLEY FINANCIAL - External Home Login

You also want an ePaper? Increase the reach of your titles
YUMPU automatically turns print PDFs into web optimized ePapers that Google loves.
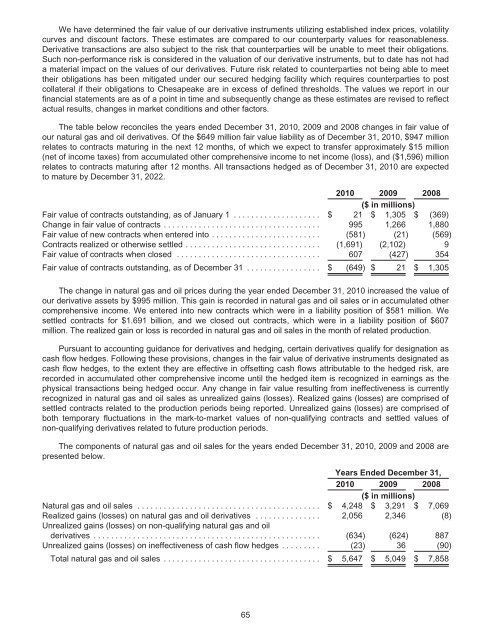
We have determined the fair value of our derivative instruments utilizing established index prices, volatility<br />
curves and discount factors. These estimates are compared to our counterparty values for reasonableness.<br />
Derivative transactions are also subject to the risk that counterparties will be unable to meet their obligations.<br />
Such non-performance risk is considered in the valuation of our derivative instruments, but to date has not had<br />
a material impact on the values of our derivatives. Future risk related to counterparties not being able to meet<br />
their obligations has been mitigated under our secured hedging facility which requires counterparties to post<br />
collateral if their obligations to Chesapeake are in excess of defined thresholds. The values we report in our<br />
financial statements are as of a point in time and subsequently change as these estimates are revised to reflect<br />
actual results, changes in market conditions and other factors.<br />
The table below reconciles the years ended December 31, 2010, 2009 and 2008 changes in fair value of<br />
our natural gas and oil derivatives. Of the $649 million fair value liability as of December 31, 2010, $947 million<br />
relates to contracts maturing in the next 12 months, of which we expect to transfer approximately $15 million<br />
(net of income taxes) from accumulated other comprehensive income to net income (loss), and ($1,596) million<br />
relates to contracts maturing after 12 months. All transactions hedged as of December 31, 2010 are expected<br />
to mature by December 31, 2022.<br />
2010 2009 2008<br />
($ in millions)<br />
Fair value of contracts outstanding, as of January 1 .................... $ 21 $ 1,305 $ (369)<br />
Change in fair value of contracts .................................... 995 1,266 1,880<br />
Fair value of new contracts when entered into ......................... (581) (21) (569)<br />
Contracts realized or otherwise settled ............................... (1,691) (2,102) 9<br />
Fair value of contracts when closed ................................. 607 (427) 354<br />
Fair value of contracts outstanding, as of December 31 ................. $ (649) $ 21 $ 1,305<br />
The change in natural gas and oil prices during the year ended December 31, 2010 increased the value of<br />
our derivative assets by $995 million. This gain is recorded in natural gas and oil sales or in accumulated other<br />
comprehensive income. We entered into new contracts which were in a liability position of $581 million. We<br />
settled contracts for $1.691 billion, and we closed out contracts, which were in a liability position of $607<br />
million. The realized gain or loss is recorded in natural gas and oil sales in the month of related production.<br />
Pursuant to accounting guidance for derivatives and hedging, certain derivatives qualify for designation as<br />
cash flow hedges. Following these provisions, changes in the fair value of derivative instruments designated as<br />
cash flow hedges, to the extent they are effective in offsetting cash flows attributable to the hedged risk, are<br />
recorded in accumulated other comprehensive income until the hedged item is recognized in earnings as the<br />
physical transactions being hedged occur. Any change in fair value resulting from ineffectiveness is currently<br />
recognized in natural gas and oil sales as unrealized gains (losses). Realized gains (losses) are comprised of<br />
settled contracts related to the production periods being reported. Unrealized gains (losses) are comprised of<br />
both temporary fluctuations in the mark-to-market values of non-qualifying contracts and settled values of<br />
non-qualifying derivatives related to future production periods.<br />
The components of natural gas and oil sales for the years ended December 31, 2010, 2009 and 2008 are<br />
presented below.<br />
Years Ended December 31,<br />
2010 2009 2008<br />
($ in millions)<br />
Natural gas and oil sales .......................................... $ 4,248 $ 3,291 $ 7,069<br />
Realized gains (losses) on natural gas and oil derivatives ............... 2,056 2,346 (8)<br />
Unrealized gains (losses) on non-qualifying natural gas and oil<br />
derivatives .................................................... (634) (624) 887<br />
Unrealized gains (losses) on ineffectiveness of cash flow hedges ......... (23) 36 (90)<br />
Total natural gas and oil sales .................................... $ 5,647 $ 5,049 $ 7,858<br />
65