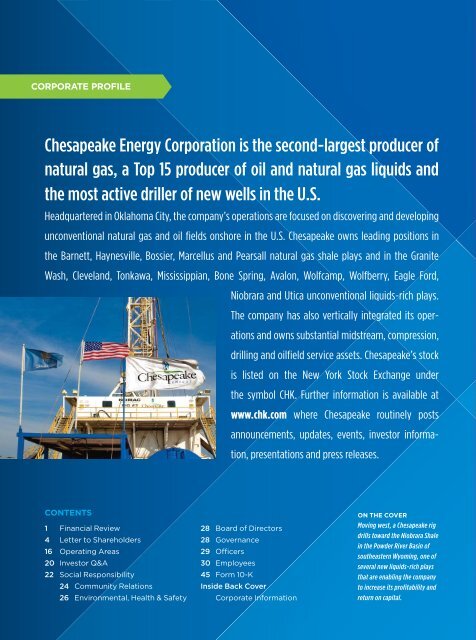
CORPORATE PROFILE Chesapeake Energy Corporation is the second-largest producer of natural gas, a Top 15 producer of oil and natural gas liquids and the most active driller of new wells in the U.S. Headquartered in Oklahoma City, the company’s operations are focused on discovering and developing unconventional natural gas and oil fields onshore in the U.S. Chesapeake owns leading positions in the Barnett, Haynesville, Bossier, Marcellus and Pearsall natural gas shale plays and in the Granite Wash, Cleveland, Tonkawa, Mississippian, Bone Spring, Avalon, Wolfcamp, Wolfberry, Eagle Ford, CONTENTS 1 Financial Review 4 Letter to Shareholders 16 Operating Areas 20 Investor Q&A 22 Social Responsibility 24 Community Relations 26 Environmental, Health & Safety Niobrara and Utica unconventional liquids-rich plays. The company has also vertically integrated its oper- ations and owns substantial midstream, compression, drilling and oilfield service assets. Chesapeake’s stock is listed on the New York Stock Exchange under the symbol CHK. Further information is available at www.chk.com where Chesapeake routinely posts announcements, updates, events, investor informa- tion, presentations and press releases. 28 Board of Directors 28 Governance 29 Officers 30 Employees 45 Form 10-K Inside Back Cover Corporate Information ON THE COVER Moving west, a Chesapeake rig drills toward the Niobrara Shale in the Powder River Basin of southeastern Wyoming, one of several new liquids-rich plays that are enabling the company to increase its profitability and return on capital.
1 | <strong>FINANCIAL</strong> REVIEW 2010 ANNUAL REPORT | 2 <strong>FINANCIAL</strong> REVIEW » ($ in millions, except per share data) Years Ended December 31 Six Months Ended December 31 Years Ended June 30 Financial and Operating Data 2010 2009 2008 2007 2006 2005 2004 2003 2002 2001 2000 1999 1998 1997 1997 1996 1995 1994 1993 Revenues Natural gas and oil sales $ 5,647 $ 5,049 $ 7,858 $ 5,624 $ 5,619 $ 3,273 $ 1,936 $ 1,297 $ 568 $ 820 $ 470 $ 280 $ 257 $ 96 $ 193 $ 111 $ 57 $ 22 $ 12 Marketing, gathering, compression and service operations sales 3,719 2,653 3,771 2,176 1,707 1,392 773 420 171 149 158 75 121 58 76 35 9 7 5 Total revenues 9,366 7,702 11,629 7,800 7,326 4,665 2,709 1,717 739 969 628 355 378 154 269 146 66 29 17 Operating costs Production expenses 893 876 889 640 490 317 205 138 98 75 50 46 51 8 11 6 3 2 3 Production taxes 157 107 284 216 176 208 104 78 30 33 25 13 8 2 4 2 1 2 — General and administrative expenses 453 349 377 243 139 64 37 24 18 15 13 13 20 6 9 5 4 3 3 Marketing, gathering, compression and service operations expenses 3,560 2,498 3,648 2,063 1,590 1,358 755 410 166 144 152 72 119 58 75 33 8 5 4 Depreciation, depletion and amortization 1,614 1,615 2,144 1,988 1,462 945 611 386 235 182 109 103 155 63 107 54 27 10 5 Impairments and other (116 ) 11,202 2,830 — 55 — 5 6 — — — — 881 110 236 — — — 1 Total operating costs 6,561 16,647 10,172 5,150 3,912 2,892 1,717 1,042 547 449 349 247 1,234 247 442 100 43 22 16 Income (loss) from operations 2,805 (8,945 ) 1,457 2,650 3,414 1,773 992 675 192 520 279 108 (856 ) (93 ) (173 ) 46 23 7 1 Interest expense (19 ) (113 ) (271 ) (401 ) (316 ) (221 ) (167 ) (154 ) (112 ) (98 ) (86 ) (81 ) (68 ) (18 ) (18 ) (14 ) (7 ) (3 ) (2 ) Other income (expense) 243 (28 ) (11 ) 15 26 10 5 1 7 3 3 8 4 79 11 4 2 1 1 Miscellaneous gains (losses) (145 ) (202 ) (184 ) 83 117 (70 ) (25 ) (21 ) (20 ) (63 ) — — (14 ) — (7 ) — — — — Total other income (expense) 79 (343 ) (466 ) (303 ) (173 ) (281 ) (187 ) (174 ) (125 ) (158 ) (83 ) (73 ) (78 ) 61 (14 ) (10 ) (5 ) (2 ) (1 ) Income (loss) before income taxes and cumulative effect of accounting change 2,884 (9,288 ) 991 2,347 3,241 1,492 805 501 67 362 196 35 (934 ) (32 ) (187 ) 36 18 5 — Income tax expense (benefit): Current — 4 423 29 5 — — 5 (2 ) 4 — — — — — — — — — Deferred 1,110 (3,487 ) (36 ) 863 1,242 545 290 185 29 141 (260 ) 2 — — (4 ) 13 6 1 — Net income (loss) before cumulative effect of accounting change, net of tax 1,774 (5,805 ) 604 1,455 1,994 947 515 311 40 217 456 33 (934 ) (32 ) (183 ) 23 12 4 — Net (income) loss attributable to noncontrolling interest — (25 ) — — — — — — — — — — — — — — — — — Cumulative effect of accounting change, net of tax — — — — — — — 2 — — — — — — — — — — — Net income (loss) 1,774 (5,830 ) 604 1,455 1,994 947 515 313 40 217 456 33 (934 ) (32 ) (183 ) 23 12 4 — Preferred stock dividends (111 ) (23 ) (33 ) (94 ) (89 ) (42 ) (40 ) (22 ) (10 ) (2 ) (9 ) (16 ) (12 ) — — — — — (1 ) Gain (loss) on conversion/exchange of preferred stock — — (67 ) (128 ) (10 ) (26 ) (36 ) — — — 7 — — — — — — — — Net income (loss) available to common shareholders $ 1,663 $ (5,853 ) $ 504 $ 1,233 $ 1,895 $ 879 $ 439 $ 291 $ 30 $ 215 $ 454 $ 17 $ (946 ) $ (32 ) $ (183 ) $ 23 $ 12 $ 4 $ (1 ) Earnings per common share – basic: Income (loss) before cumulative effect of accounting change $ 2.63 $ (9.57 ) $ 0.94 $ 2.70 $ 4.76 $ 2.73 $ 1.73 $ 1.36 $ 0.18 $ 1.33 $ 3.52 $ 0.17 $ (9.97 ) $ (0.45 ) $ (2.79 ) $ 0.43 $ 0.22 $ 0.08 $ (0.02 ) Cumulative effect of accounting change — — — — — — — 0.02 — — — — — — — — — — — EPS – basic $ 2.63 $ (9.57 ) $ 0.94 $ 2.70 $ 4.76 $ 2.73 $ 1.73 $ 1.38 $ 0.18 $ 1.33 $ 3.52 $ 0.17 $ (9.97 ) $ (0.45 ) $ (2.79 ) $ 0.43 $ 0.22 $ 0.08 $ (0.02 ) Earnings per common share – diluted: Income (loss) before cumulative effect of accounting change $ 2.51 $ (9.57 ) $ 0.93 $ 2.63 $ 4.33 $ 2.51 $ 1.53 $ 1.20 $ 0.17 $ 1.25 $ 3.01 $ 0.16 $ (9.97 ) $ (0.45 ) $ (2.79 ) $ 0.40 $ 0.21 $ 0.08 $ (0.02 ) Cumulative effect of accounting change — — — — — — — 0.01 — — — — — — — — — — — EPS – diluted $ 2.51 $ (9.57 ) $ 0.93 $ 2.63 $ 4.33 $ 2.51 $ 1.53 $ 1.21 $ 0.17 $ 1.25 $ 3.01 $ 0.16 $ (9.97 ) $ (0.45 ) $ (2.79 ) $ 0.40 $ 0.21 $ 0.08 $ (0.02 ) Cash provided by (used in) operating activities (GAAP) $ 5,117 $ 4,356 $ 5,357 $ 4,974 $ 4,843 $ 2,407 $ 1,432 $ 939 $ 429 $ 478 $ 315 $ 145 $ 95 $ 139 $ 84 $ 121 $ 55 $ 19 $ (1 ) Operating cash flow (non-GAAP)* $ 4,548 $ 4,333 $ 5,299 $ 4,675 $ 4,040 $ 2,426 $ 1,403 $ 897 $ 409 $ 443 $ 306 $ 139 $ 118 $ 68 $ 161 $ 88 $ 46 $ 16 $ 4 Balance Sheet Data (at end of period) Total assets $ 37,179 $ 29,914 $ 38,593 $ 30,764 $ 24,413 $ 16,114 $ 8,245 $ 4,572 $ 2,876 $ 2,287 $ 1,440 $ 851 $ 813 $ 953 $ 949 $ 572 $ 277 $ 126 $ 79 Long-term debt, net of current maturities $ 12,640 $ 12,295 $ 13,175 $ 10,178 $ 7,187 $ 5,286 $ 3,075 $ 2,058 $ 1,651 $ 1,329 $ 945 $ 964 $ 919 $ 509 $ 509 $ 268 $ 146 $ 48 $ 14 Stockholders’ equity (deficit) $ 15,264 $ 12,341 $ 17,017 $ 12,624 $ 11,366 $ 6,299 $ 3,163 $ 1,733 $ 908 $ 767 $ 313 $ (218 ) $ (249 ) $ 280 $ 287 $ 178 $ 45 $ 31 $ 31 Other Operating and Financial Data Proved reserves in natural gas equivalents (bcfe) 17,096 14,254 12,051 10,879 8,956 7,521 4,902 3,169 2,205 1,780 1,355 1,206 1,091 448 403 425 243 142 137 Future net natural gas and oil revenues discounted at 10%** $ 15,146 $ 9,449 $ 15,601 $ 20,573 $ 13,647 $ 22,934 $ 10,504 $ 7,333 $ 3,718 $ 1,647 $ 6,046 $ 1,089 $ 661 $ 467 $ 437 $ 547 $ 188 $ 141 $ 142 Natural gas price used in reserve report (per mcf)*** $ 3.52 $ 3.13 $ 5.12 $ 6.19 $ 5.41 $ 8.76 $ 5.65 $ 5.68 $ 4.28 $ 2.51 $ 10.12 $ 2.25 $ 1.68 $ 2.29 $ 2.12 $ 2.41 $ 1.60 $ 1.98 $ 2.43 Oil price used in reserve report (per bbl)*** $ 75.17 $ 56.72 $ 41.60 $ 90.58 $ 56.25 $ 56.41 $ 39.91 $ 30.22 $ 30.18 $ 18.82 $ 26.41 $ 24.72 $ 10.48 $ 17.62 $ 18.38 $ 20.90 $ 17.41 $ 18.27 $ 18.71 Natural gas production (bcf) 925 835 775 655 526 422 322 240 161 144 116 109 94 27 62 52 25 7 3 Oil production (mmbbl) 18.4 11.8 11.2 9.9 8.7 7.7 6.8 4.7 3.5 2.9 3.1 4.1 6.0 1.9 2.8 1.4 1.1 0.5 0.3 Production (bcfe) 1,035 906 843 714 578 469 363 268 181 161 134 133 130 38 79 60 32 10 4 Sales price per mcfe**** $ 6.09 $ 6.22 $ 8.38 $ 8.40 $ 8.86 $ 6.90 $ 5.23 $ 4.79 $ 3.61 $ 4.56 $ 3.50 $ 2.10 $ 1.97 $ 2.49 $ 2.45 $ 1.84 $ 1.78 $ 2.21 $ 2.68 Production expense per mcfe $ 0.86 $ 0.97 $ 1.05 $ 0.90 $ 0.85 $ 0.68 $ 0.56 $ 0.51 $ 0.54 $ 0.47 $ 0.37 $ 0.35 $ 0.39 $ 0.20 $ 0.15 $ 0.11 $ 0.11 $ 0.21 $ 0.67 Production taxes per mcfe $ 0.15 $ 0.12 $ 0.34 $ 0.30 $ 0.31 $ 0.44 $ 0.29 $ 0.29 $ 0.17 $ 0.20 $ 0.19 $ 0.10 $ 0.06 $ 0.07 $ 0.05 $ 0.03 $ 0.03 $ 0.15 — General and administrative expense per mcfe $ 0.44 $ 0.38 $ 0.45 $ 0.34 $ 0.24 $ 0.14 $ 0.10 $ 0.09 $ 0.10 $ 0.09 $ 0.10 $ 0.10 $ 0.15 $ 0.15 $ 0.11 $ 0.08 $ 0.11 $ 0.31 $ 0.84 Depreciation, depletion and amortization expense per mcfe $ 1.56 $ 1.78 $ 2.55 $ 2.78 $ 2.53 $ 2.02 $ 1.69 $ 1.44 $ 1.30 $ 1.12 $ 0.81 $ 0.77 $ 1.19 $ 1.63 $ 1.36 $ 0.90 $ 0.85 $ 0.99 $ 1.09 Number of employees (full-time at end of period) 10,021 8,152 7,649 6,219 4,883 2,885 1,718 1,192 866 677 462 424 481 360 362 344 325 250 150 Cash dividends declared per common share $ 0.30 $ 0.30 $ 0.2925 $ 0.2625 $ 0.23 $ 0.195 $ 0.17 $ 0.135 $ 0.06 — — — $ 0.04 $ 0.04 $ 0.02 — — — — Stock price (at end of period – split adjusted) $ 25.91 $ 25.88 $ 16.17 $ 39.20 $ 29.05 $ 31.73 $ 16.50 $ 13.58 $ 7.74 $ 6.61 $ 10.12 $ 2.38 $ 0.94 $ 7.50 $ 9.81 $ 29.52 $ 5.64 $ 0.85 $ 1.18 * See page 14 for definition of this non-GAAP measure. ** PV-10 is the present value (10% discount rate) of estimated future gross revenues to be generated from the production of proved reserves, net of production and future development costs, using assumed prices and costs. Please see page 113 of our Form 10-K for information on the standardized measure of discounted future net cash flows. *** Adjusted for field differentials. **** Excludes unrealized gains (losses) natural gas and oil hedging.
- Page 1: 2010: A YEAR OF TRANSITION AND ACHI
- Page 5 and 6: 4 | LETTER TO SHAREHOLDERS DEAR FEL
- Page 7 and 8: 6 | LETTER TO SHAREHOLDERS vs. an a
- Page 9 and 10: 8 | LETTER TO SHAREHOLDERS Growing
- Page 11 and 12: 10 | LETTER TO SHAREHOLDERS with th
- Page 13 and 14: 12 | LETTER TO SHAREHOLDERS wet nat
- Page 15 and 16: 14 | LETTER TO SHAREHOLDERS Rig lig
- Page 17 and 18: 16 | OPERATING AREAS AMERICA’S PR
- Page 19 and 20: 2010 ANNUAL REPORT | 19 Unconcerned
- Page 21 and 22: What advantages does CHK’s unique
- Page 23 and 24: 2010 ANNUAL REPORT | 23 Employees l
- Page 25 and 26: to selected students pursuing caree
- Page 27 and 28: process is saving the company an av
- Page 29 and 30: OFFICERS » Aubrey K. McClendon Cha
- Page 31 and 32: George Bradley Kim Brady David Bran
- Page 33 and 34: Daniel Alford Kenny Alford Jamie Al
- Page 35 and 36: Danny Games Felipe Garcia Melissa G
- Page 37 and 38: Jeff C. Glenn Jeannie Harris Larry
- Page 39 and 40: Allison Earl Shannon Earley Jeremy
- Page 41 and 42: Michael Bowling Jesse Bowman Matthe
- Page 43 and 44: Terrydon Maroney Maria Marquez Ken
- Page 45 and 46: UNITED STATES SECURITIES AND EXCHAN
- Page 47 and 48: ITEM 1. Business Our Business Part
- Page 49 and 50: Information About Us Our principal
- Page 51 and 52: Build Operating Focus and Scale. We
- Page 53 and 54:
Eagle Ford Shale. Chesapeake’s Ea
- Page 55 and 56:
Production, Sales, Prices and Expen
- Page 57 and 58:
are based on prices, costs and disc
- Page 59 and 60:
The table below compares our estima
- Page 61 and 62:
Exploration and Development, Acquis
- Page 63 and 64:
Our marketing activities, along wit
- Page 65 and 66:
govern our operations carry substan
- Page 67 and 68:
Title to Properties Our title to pr
- Page 69 and 70:
Present Value or PV-10. When used w
- Page 71 and 72:
ITEM 1A. Risk Factors Natural gas a
- Page 73 and 74:
eserves will require significant ca
- Page 75 and 76:
least 1.65 times. Under certain cir
- Page 77 and 78:
Our operations may be adversely aff
- Page 79 and 80:
Part II ITEM 5. Market for Registra
- Page 81 and 82:
Years Ended December 31, 2010 2009
- Page 83 and 84:
(c) Includes the effects of realize
- Page 85 and 86:
Our goal of a 25% reduction in debt
- Page 87 and 88:
customary conditions, including fil
- Page 89 and 90:
In 2010, we received cash distribut
- Page 91 and 92:
Corporate Credit Facility. Our $4.0
- Page 93 and 94:
optional repurchase dates, the comm
- Page 95 and 96:
The estimated fair values of our na
- Page 97 and 98:
For 2010, we realized an average pr
- Page 99 and 100:
The following table shows our produ
- Page 101 and 102:
Interest Expense. Interest expense
- Page 103 and 104:
The selection and application of ac
- Page 105 and 106:
Under accounting guidance for incom
- Page 107 and 108:
Although we believe the expectation
- Page 109 and 110:
As of December 31, 2010, we had the
- Page 111 and 112:
We have determined the fair value o
- Page 113 and 114:
(a) Month LIBOR has been abbreviate
- Page 115 and 116:
MANAGEMENT’S REPORT ON INTERNAL C
- Page 117 and 118:
CHESAPEAKE ENERGY CORPORATION AND S
- Page 119 and 120:
CHESAPEAKE ENERGY CORPORATION AND S
- Page 121 and 122:
CHESAPEAKE ENERGY CORPORATION AND S
- Page 123 and 124:
CHESAPEAKE ENERGY CORPORATION AND S
- Page 125 and 126:
CHESAPEAKE ENERGY CORPORATION AND S
- Page 127 and 128:
CHESAPEAKE ENERGY CORPORATION AND S
- Page 129 and 130:
CHESAPEAKE ENERGY CORPORATION AND S
- Page 131 and 132:
CHESAPEAKE ENERGY CORPORATION AND S
- Page 133 and 134:
CHESAPEAKE ENERGY CORPORATION AND S
- Page 135 and 136:
CHESAPEAKE ENERGY CORPORATION AND S
- Page 137 and 138:
Compressor Leases CHESAPEAKE ENERGY
- Page 139 and 140:
5. Income Taxes CHESAPEAKE ENERGY C
- Page 141 and 142:
CHESAPEAKE ENERGY CORPORATION AND S
- Page 143 and 144:
CHESAPEAKE ENERGY CORPORATION AND S
- Page 145 and 146:
CHESAPEAKE ENERGY CORPORATION AND S
- Page 147 and 148:
CHESAPEAKE ENERGY CORPORATION AND S
- Page 149 and 150:
CHESAPEAKE ENERGY CORPORATION AND S
- Page 151 and 152:
CHESAPEAKE ENERGY CORPORATION AND S
- Page 153 and 154:
CHESAPEAKE ENERGY CORPORATION AND S
- Page 155 and 156:
CHESAPEAKE ENERGY CORPORATION AND S
- Page 157 and 158:
CHESAPEAKE ENERGY CORPORATION AND S
- Page 159 and 160:
CHESAPEAKE ENERGY CORPORATION AND S
- Page 161 and 162:
11. Divestitures CHESAPEAKE ENERGY
- Page 163 and 164:
CHESAPEAKE ENERGY CORPORATION AND S
- Page 165 and 166:
13. Restructuring Costs CHESAPEAKE
- Page 167 and 168:
CHESAPEAKE ENERGY CORPORATION AND S
- Page 169 and 170:
CHESAPEAKE ENERGY CORPORATION AND S
- Page 171 and 172:
CHESAPEAKE ENERGY CORPORATION AND S
- Page 173 and 174:
CHESAPEAKE ENERGY CORPORATION AND S
- Page 175 and 176:
CHESAPEAKE ENERGY CORPORATION AND S
- Page 177 and 178:
CHESAPEAKE ENERGY CORPORATION AND S
- Page 179 and 180:
CHESAPEAKE ENERGY CORPORATION AND S
- Page 181 and 182:
Schedule II Description CHESAPEAKE
- Page 183 and 184:
PART III ITEM 10. Directors, Execut
- Page 185 and 186:
Exhibit Number Exhibit Description
- Page 187 and 188:
Exhibit Number Exhibit Description
- Page 189 and 190:
Exhibit Number Exhibit Description
- Page 191 and 192:
CORPORATE INFORMATION Corporate Hea