6 5 - RR DONNELLEY FINANCIAL - External Home Login
6 5 - RR DONNELLEY FINANCIAL - External Home Login
6 5 - RR DONNELLEY FINANCIAL - External Home Login

You also want an ePaper? Increase the reach of your titles
YUMPU automatically turns print PDFs into web optimized ePapers that Google loves.
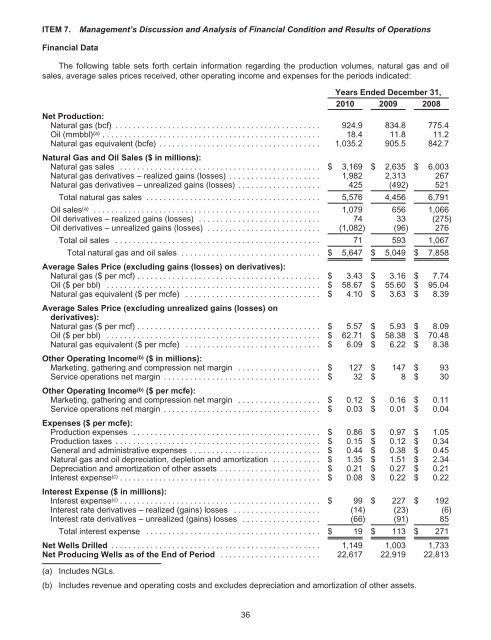
ITEM 7. Management’s Discussion and Analysis of Financial Condition and Results of Operations<br />
Financial Data<br />
The following table sets forth certain information regarding the production volumes, natural gas and oil<br />
sales, average sales prices received, other operating income and expenses for the periods indicated:<br />
Years Ended December 31,<br />
2010 2009 2008<br />
Net Production:<br />
Natural gas (bcf) ............................................... 924.9 834.8 775.4<br />
Oil (mmbbl) (a) .................................................. 18.4 11.8 11.2<br />
Natural gas equivalent (bcfe) .....................................<br />
Natural Gas and Oil Sales ($ in millions):<br />
1,035.2 905.5 842.7<br />
Natural gas sales .............................................. $ 3,169 $ 2,635 $ 6,003<br />
Natural gas derivatives – realized gains (losses) ..................... 1,982 2,313 267<br />
Natural gas derivatives – unrealized gains (losses) ................... 425 (492) 521<br />
Total natural gas sales ........................................ 5,576 4,456 6,791<br />
Oil sales (a) .................................................... 1,079 656 1,066<br />
Oil derivatives – realized gains (losses) ............................ 74 33 (275)<br />
Oil derivatives – unrealized gains (losses) .......................... (1,082) (96) 276<br />
Total oil sales ............................................... 71 593 1,067<br />
Total natural gas and oil sales ................................ $ 5,647 $ 5,049 $ 7,858<br />
Average Sales Price (excluding gains (losses) on derivatives):<br />
Natural gas ($ per mcf) .......................................... $ 3.43 $ 3.16 $ 7.74<br />
Oil ($ per bbl) ................................................. $ 58.67 $ 55.60 $ 95.04<br />
Natural gas equivalent ($ per mcfe) ...............................<br />
Average Sales Price (excluding unrealized gains (losses) on<br />
derivatives):<br />
$ 4.10 $ 3.63 $ 8.39<br />
Natural gas ($ per mcf) .......................................... $ 5.57 $ 5.93 $ 8.09<br />
Oil ($ per bbl) ................................................. $ 62.71 $ 58.38 $ 70.48<br />
Natural gas equivalent ($ per mcfe) ...............................<br />
Other Operating Income<br />
$ 6.09 $ 6.22 $ 8.38<br />
(b) ($ in millions):<br />
Marketing, gathering and compression net margin ................... $ 127 $ 147 $ 93<br />
Service operations net margin ....................................<br />
Other Operating Income<br />
$ 32 $ 8 $ 30<br />
(b) ($ per mcfe):<br />
Marketing, gathering and compression net margin ................... $ 0.12 $ 0.16 $ 0.11<br />
Service operations net margin ....................................<br />
Expenses ($ per mcfe):<br />
$ 0.03 $ 0.01 $ 0.04<br />
Production expenses ........................................... $ 0.86 $ 0.97 $ 1.05<br />
Production taxes ............................................... $ 0.15 $ 0.12 $ 0.34<br />
General and administrative expenses .............................. $ 0.44 $ 0.38 $ 0.45<br />
Natural gas and oil depreciation, depletion and amortization ........... $ 1.35 $ 1.51 $ 2.34<br />
Depreciation and amortization of other assets ....................... $ 0.21 $ 0.27 $ 0.21<br />
Interest expense (c) ..............................................<br />
Interest Expense ($ in millions):<br />
$ 0.08 $ 0.22 $ 0.22<br />
Interest expense (c) .............................................. $ 99 $ 227 $ 192<br />
Interest rate derivatives – realized (gains) losses .................... (14) (23) (6)<br />
Interest rate derivatives – unrealized (gains) losses .................. (66) (91) 85<br />
Total interest expense ........................................ $ 19 $ 113 $ 271<br />
Net Wells Drilled ................................................ 1,149 1,003 1,733<br />
Net Producing Wells as of the End of Period ....................... 22,617 22,919 22,813<br />
(a) Includes NGLs.<br />
(b) Includes revenue and operating costs and excludes depreciation and amortization of other assets.<br />
36