6 5 - RR DONNELLEY FINANCIAL - External Home Login
6 5 - RR DONNELLEY FINANCIAL - External Home Login
6 5 - RR DONNELLEY FINANCIAL - External Home Login

You also want an ePaper? Increase the reach of your titles
YUMPU automatically turns print PDFs into web optimized ePapers that Google loves.
1 | <strong>FINANCIAL</strong> REVIEW 2010 ANNUAL REPORT | 2<br />
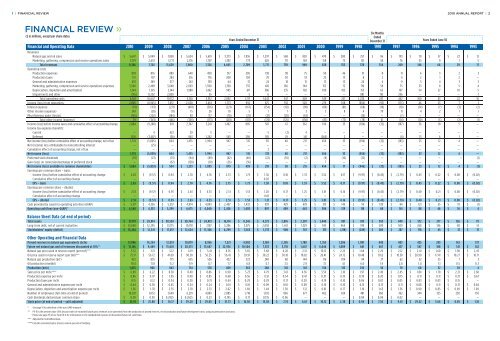
<strong>FINANCIAL</strong> REVIEW »<br />
($ in millions, except per share data)<br />
Years Ended December 31<br />
Six Months<br />
Ended<br />
December 31<br />
Years Ended June 30<br />
Financial and Operating Data 2010 2009 2008 2007 2006 2005 2004 2003 2002 2001 2000 1999 1998 1997 1997 1996 1995 1994 1993<br />
Revenues<br />
Natural gas and oil sales $ 5,647 $ 5,049 $ 7,858 $ 5,624 $ 5,619 $ 3,273 $ 1,936 $ 1,297 $ 568 $ 820 $ 470 $ 280 $ 257 $ 96 $ 193 $ 111 $ 57 $ 22 $ 12<br />
Marketing, gathering, compression and service operations sales 3,719 2,653 3,771 2,176 1,707 1,392 773 420 171 149 158 75 121 58 76 35 9 7 5<br />
Total revenues 9,366 7,702 11,629 7,800 7,326 4,665 2,709 1,717 739 969 628 355 378 154 269 146 66 29 17<br />
Operating costs<br />
Production expenses 893 876 889 640 490 317 205 138 98 75 50 46 51 8 11 6 3 2 3<br />
Production taxes 157 107 284 216 176 208 104 78 30 33 25 13 8 2 4 2 1 2 —<br />
General and administrative expenses 453 349 377 243 139 64 37 24 18 15 13 13 20 6 9 5 4 3 3<br />
Marketing, gathering, compression and service operations expenses 3,560 2,498 3,648 2,063 1,590 1,358 755 410 166 144 152 72 119 58 75 33 8 5 4<br />
Depreciation, depletion and amortization 1,614 1,615 2,144 1,988 1,462 945 611 386 235 182 109 103 155 63 107 54 27 10 5<br />
Impairments and other (116 ) 11,202 2,830 — 55 — 5 6 — — — — 881 110 236 — — — 1<br />
Total operating costs 6,561 16,647 10,172 5,150 3,912 2,892 1,717 1,042 547 449 349 247 1,234 247 442 100 43 22 16<br />
Income (loss) from operations 2,805 (8,945 ) 1,457 2,650 3,414 1,773 992 675 192 520 279 108 (856 ) (93 ) (173 ) 46 23 7 1<br />
Interest expense (19 ) (113 ) (271 ) (401 ) (316 ) (221 ) (167 ) (154 ) (112 ) (98 ) (86 ) (81 ) (68 ) (18 ) (18 ) (14 ) (7 ) (3 ) (2 )<br />
Other income (expense) 243 (28 ) (11 ) 15 26 10 5 1 7 3 3 8 4 79 11 4 2 1 1<br />
Miscellaneous gains (losses) (145 ) (202 ) (184 ) 83 117 (70 ) (25 ) (21 ) (20 ) (63 ) — — (14 ) — (7 ) — — — —<br />
Total other income (expense) 79 (343 ) (466 ) (303 ) (173 ) (281 ) (187 ) (174 ) (125 ) (158 ) (83 ) (73 ) (78 ) 61 (14 ) (10 ) (5 ) (2 ) (1 )<br />
Income (loss) before income taxes and cumulative effect of accounting change 2,884 (9,288 ) 991 2,347 3,241 1,492 805 501 67 362 196 35 (934 ) (32 ) (187 ) 36 18 5 —<br />
Income tax expense (benefit):<br />
Current — 4 423 29 5 — — 5 (2 ) 4 — — — — — — — — —<br />
Deferred 1,110 (3,487 ) (36 ) 863 1,242 545 290 185 29 141 (260 ) 2 — — (4 ) 13 6 1 —<br />
Net income (loss) before cumulative effect of accounting change, net of tax 1,774 (5,805 ) 604 1,455 1,994 947 515 311 40 217 456 33 (934 ) (32 ) (183 ) 23 12 4 —<br />
Net (income) loss attributable to noncontrolling interest — (25 ) — — — — — — — — — — — — — — — — —<br />
Cumulative effect of accounting change, net of tax — — — — — — — 2 — — — — — — — — — — —<br />
Net income (loss) 1,774 (5,830 ) 604 1,455 1,994 947 515 313 40 217 456 33 (934 ) (32 ) (183 ) 23 12 4 —<br />
Preferred stock dividends (111 ) (23 ) (33 ) (94 ) (89 ) (42 ) (40 ) (22 ) (10 ) (2 ) (9 ) (16 ) (12 ) — — — — — (1 )<br />
Gain (loss) on conversion/exchange of preferred stock — — (67 ) (128 ) (10 ) (26 ) (36 ) — — — 7 — — — — — — — —<br />
Net income (loss) available to common shareholders $ 1,663 $ (5,853 ) $ 504 $ 1,233 $ 1,895 $ 879 $ 439 $ 291 $ 30 $ 215 $ 454 $ 17 $ (946 ) $ (32 ) $ (183 ) $ 23 $ 12 $ 4 $ (1 )<br />
Earnings per common share – basic:<br />
Income (loss) before cumulative effect of accounting change $ 2.63 $ (9.57 ) $ 0.94 $ 2.70 $ 4.76 $ 2.73 $ 1.73 $ 1.36 $ 0.18 $ 1.33 $ 3.52 $ 0.17 $ (9.97 ) $ (0.45 ) $ (2.79 ) $ 0.43 $ 0.22 $ 0.08 $ (0.02 )<br />
Cumulative effect of accounting change — — — — — — — 0.02 — — — — — — — — — — —<br />
EPS – basic $ 2.63 $ (9.57 ) $ 0.94 $ 2.70 $ 4.76 $ 2.73 $ 1.73 $ 1.38 $ 0.18 $ 1.33 $ 3.52 $ 0.17 $ (9.97 ) $ (0.45 ) $ (2.79 ) $ 0.43 $ 0.22 $ 0.08 $ (0.02 )<br />
Earnings per common share – diluted:<br />
Income (loss) before cumulative effect of accounting change $ 2.51 $ (9.57 ) $ 0.93 $ 2.63 $ 4.33 $ 2.51 $ 1.53 $ 1.20 $ 0.17 $ 1.25 $ 3.01 $ 0.16 $ (9.97 ) $ (0.45 ) $ (2.79 ) $ 0.40 $ 0.21 $ 0.08 $ (0.02 )<br />
Cumulative effect of accounting change — — — — — — — 0.01 — — — — — — — — — — —<br />
EPS – diluted $ 2.51 $ (9.57 ) $ 0.93 $ 2.63 $ 4.33 $ 2.51 $ 1.53 $ 1.21 $ 0.17 $ 1.25 $ 3.01 $ 0.16 $ (9.97 ) $ (0.45 ) $ (2.79 ) $ 0.40 $ 0.21 $ 0.08 $ (0.02 )<br />
Cash provided by (used in) operating activities (GAAP) $ 5,117 $ 4,356 $ 5,357 $ 4,974 $ 4,843 $ 2,407 $ 1,432 $ 939 $ 429 $ 478 $ 315 $ 145 $ 95 $ 139 $ 84 $ 121 $ 55 $ 19 $ (1 )<br />
Operating cash flow (non-GAAP)* $ 4,548 $ 4,333 $ 5,299 $ 4,675 $ 4,040 $ 2,426 $ 1,403 $ 897 $ 409 $ 443 $ 306 $ 139 $ 118 $ 68 $ 161 $ 88 $ 46 $ 16 $ 4<br />
Balance Sheet Data (at end of period)<br />
Total assets $ 37,179 $ 29,914 $ 38,593 $ 30,764 $ 24,413 $ 16,114 $ 8,245 $ 4,572 $ 2,876 $ 2,287 $ 1,440 $ 851 $ 813 $ 953 $ 949 $ 572 $ 277 $ 126 $ 79<br />
Long-term debt, net of current maturities $ 12,640 $ 12,295 $ 13,175 $ 10,178 $ 7,187 $ 5,286 $ 3,075 $ 2,058 $ 1,651 $ 1,329 $ 945 $ 964 $ 919 $ 509 $ 509 $ 268 $ 146 $ 48 $ 14<br />
Stockholders’ equity (deficit) $ 15,264 $ 12,341 $ 17,017 $ 12,624 $ 11,366 $ 6,299 $ 3,163 $ 1,733 $ 908 $ 767 $ 313 $ (218 ) $ (249 ) $ 280 $ 287 $ 178 $ 45 $ 31 $ 31<br />
Other Operating and Financial Data<br />
Proved reserves in natural gas equivalents (bcfe) 17,096 14,254 12,051 10,879 8,956 7,521 4,902 3,169 2,205 1,780 1,355 1,206 1,091 448 403 425 243 142 137<br />
Future net natural gas and oil revenues discounted at 10%** $ 15,146 $ 9,449 $ 15,601 $ 20,573 $ 13,647 $ 22,934 $ 10,504 $ 7,333 $ 3,718 $ 1,647 $ 6,046 $ 1,089 $ 661 $ 467 $ 437 $ 547 $ 188 $ 141 $ 142<br />
Natural gas price used in reserve report (per mcf)*** $ 3.52 $ 3.13 $ 5.12 $ 6.19 $ 5.41 $ 8.76 $ 5.65 $ 5.68 $ 4.28 $ 2.51 $ 10.12 $ 2.25 $ 1.68 $ 2.29 $ 2.12 $ 2.41 $ 1.60 $ 1.98 $ 2.43<br />
Oil price used in reserve report (per bbl)*** $ 75.17 $ 56.72 $ 41.60 $ 90.58 $ 56.25 $ 56.41 $ 39.91 $ 30.22 $ 30.18 $ 18.82 $ 26.41 $ 24.72 $ 10.48 $ 17.62 $ 18.38 $ 20.90 $ 17.41 $ 18.27 $ 18.71<br />
Natural gas production (bcf) 925 835 775 655 526 422 322 240 161 144 116 109 94 27 62 52 25 7 3<br />
Oil production (mmbbl) 18.4 11.8 11.2 9.9 8.7 7.7 6.8 4.7 3.5 2.9 3.1 4.1 6.0 1.9 2.8 1.4 1.1 0.5 0.3<br />
Production (bcfe) 1,035 906 843 714 578 469 363 268 181 161 134 133 130 38 79 60 32 10 4<br />
Sales price per mcfe**** $ 6.09 $ 6.22 $ 8.38 $ 8.40 $ 8.86 $ 6.90 $ 5.23 $ 4.79 $ 3.61 $ 4.56 $ 3.50 $ 2.10 $ 1.97 $ 2.49 $ 2.45 $ 1.84 $ 1.78 $ 2.21 $ 2.68<br />
Production expense per mcfe $ 0.86 $ 0.97 $ 1.05 $ 0.90 $ 0.85 $ 0.68 $ 0.56 $ 0.51 $ 0.54 $ 0.47 $ 0.37 $ 0.35 $ 0.39 $ 0.20 $ 0.15 $ 0.11 $ 0.11 $ 0.21 $ 0.67<br />
Production taxes per mcfe $ 0.15 $ 0.12 $ 0.34 $ 0.30 $ 0.31 $ 0.44 $ 0.29 $ 0.29 $ 0.17 $ 0.20 $ 0.19 $ 0.10 $ 0.06 $ 0.07 $ 0.05 $ 0.03 $ 0.03 $ 0.15 —<br />
General and administrative expense per mcfe $ 0.44 $ 0.38 $ 0.45 $ 0.34 $ 0.24 $ 0.14 $ 0.10 $ 0.09 $ 0.10 $ 0.09 $ 0.10 $ 0.10 $ 0.15 $ 0.15 $ 0.11 $ 0.08 $ 0.11 $ 0.31 $ 0.84<br />
Depreciation, depletion and amortization expense per mcfe $ 1.56 $ 1.78 $ 2.55 $ 2.78 $ 2.53 $ 2.02 $ 1.69 $ 1.44 $ 1.30 $ 1.12 $ 0.81 $ 0.77 $ 1.19 $ 1.63 $ 1.36 $ 0.90 $ 0.85 $ 0.99 $ 1.09<br />
Number of employees (full-time at end of period) 10,021 8,152 7,649 6,219 4,883 2,885 1,718 1,192 866 677 462 424 481 360 362 344 325 250 150<br />
Cash dividends declared per common share $ 0.30 $ 0.30 $ 0.2925 $ 0.2625 $ 0.23 $ 0.195 $ 0.17 $ 0.135 $ 0.06 — — — $ 0.04 $ 0.04 $ 0.02 — — — —<br />
Stock price (at end of period – split adjusted) $ 25.91 $ 25.88 $ 16.17 $ 39.20 $ 29.05 $ 31.73 $ 16.50 $ 13.58 $ 7.74 $ 6.61 $ 10.12 $ 2.38 $ 0.94 $ 7.50 $ 9.81 $ 29.52 $ 5.64 $ 0.85 $ 1.18<br />
* See page 14 for definition of this non-GAAP measure.<br />
** PV-10 is the present value (10% discount rate) of estimated future gross revenues to be generated from the production of proved reserves, net of production and future development costs, using assumed prices and costs.<br />
Please see page 113 of our Form 10-K for information on the standardized measure of discounted future net cash flows.<br />
*** Adjusted for field differentials.<br />
**** Excludes unrealized gains (losses) natural gas and oil hedging.