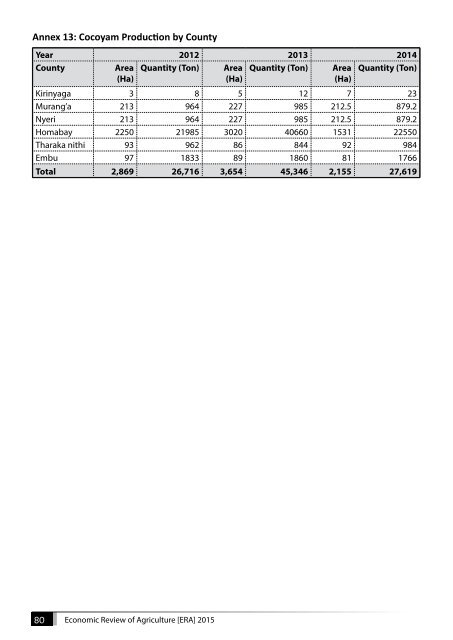
Annex 13: Cocoyam Production by County Year 2012 2013 2014 County Area Quantity (Ton) Area Quantity (Ton) Area Quantity (Ton) (Ha) (Ha) (Ha) Kirinyaga 3 8 5 12 7 23 Murang’a 213 964 227 985 212.5 879.2 Nyeri 213 964 227 985 212.5 879.2 Homabay 2250 21985 3020 40660 1531 22550 Tharaka nithi 93 962 86 844 92 984 Embu 97 1833 89 1860 81 1766 Total 2,869 26,716 3,654 45,346 2,155 27,619 80 <strong>Economic</strong> <strong>Review</strong> <strong>of</strong> <strong>Agriculture</strong> [ERA] <strong>2015</strong>
Annex 14: Capture fish production by water bodies and Counties 2012 – 2014 2012 2013 2014 Quantity Value Quantity Value Quantity Value Water body County Metric tons 000 Kshs Metric tons 000 Kshs Metric tons 000 Kshs L. Victoria Busia 4,544 472,239 5,079 610,211 5,468 642,198 L. Victoria and L. Kanyaboli Siaya 25,694 2,665,667 24,703 3,046,858 28,519 3,380,209 L. Victoria Kisumu 4,892 486,418 5,550 626,290 5,556 642,595 L. Victoria Homa bay 76,710 7,483,436 80,105 8,543,655 81,399 9,099,437 L. Victoria Migori 7,265 684,332 9,400 1,043,673 7,899 847,817 L. Turkana Turkana 2,880 295,670 4,193 425,424 4,050 417,839 L. Turkana Marsabit 121 11,712 145 13,222 116 15,951 L. Baringo Baringo 251 23,514 263 25,008 201 21,362 L. Naivasha Nakuru 143 15,460 231 17,542 331 40,664 L. Jipe Taita/Taveta 112 16,715 116 16,910 115 19,249 Tana river dams Embu 967 81,609 705 73,024 1,024 98,311 Marine and L. Kenyatta Lamu 2,312 262,412 2,506 331,398 2,507 317,958 Marine and Tana river delta) Tana River 782 69,605 849 82,511 446 72,117 Marine Kilifi 2,403 428,280 2,345 366,919 2,356 398,313 Marine Mombasa 1,066 189,104 1,178 224,869 1,219 268,969 Marine Kwale 2,373 262,287 2,358 299,449 2,643 390,782 Sub -Total 132,515 13,448,461 139,727 15,746,962 143,851 16,673,770 Source: SDF Annual Statistical Bulletins <strong>Economic</strong> <strong>Review</strong> <strong>of</strong> <strong>Agriculture</strong> [ERA] <strong>2015</strong> 81