

Economic-Review-of-Agriculture_2015-6
Economic-Review-of-Agriculture_2015-6
Economic-Review-of-Agriculture_2015-6

Create successful ePaper yourself
Turn your PDF publications into a flip-book with our unique Google optimized e-Paper software.
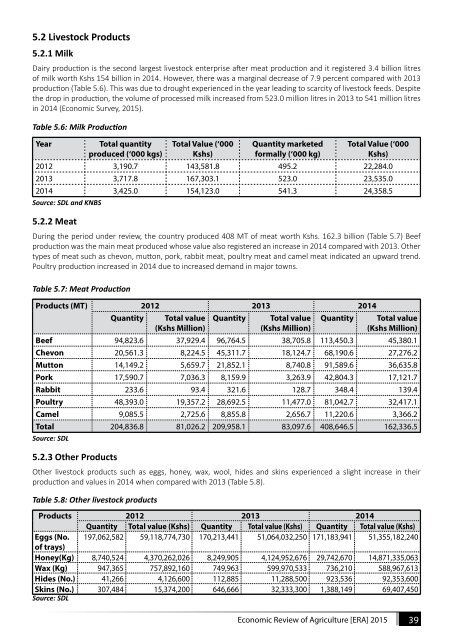
5.2 Livestock Products<br />
5.2.1 Milk<br />
Dairy production is the second largest livestock enterprise after meat production and it registered 3.4 billion litres<br />
<strong>of</strong> milk worth Kshs 154 billion in 2014. However, there was a marginal decrease <strong>of</strong> 7.9 percent compared with 2013<br />
production (Table 5.6). This was due to drought experienced in the year leading to scarcity <strong>of</strong> livestock feeds. Despite<br />
the drop in production, the volume <strong>of</strong> processed milk increased from 523.0 million litres in 2013 to 541 million litres<br />
in 2014 (<strong>Economic</strong> Survey, <strong>2015</strong>).<br />
Table 5.6: Milk Production<br />
Year<br />
Total quantity<br />
produced (‘000 kgs)<br />
Total Value (‘000<br />
Kshs)<br />
Quantity marketed<br />
formally (‘000 kg)<br />
Total Value (‘000<br />
Kshs)<br />
2012 3,190.7 143,581.8 495.2 22,284.0<br />
2013 3,717.8 167,303.1 523.0 23,535.0<br />
2014 3,425.0 154,123.0 541.3 24,358.5<br />
Source: SDL and KNBS<br />
5.2.2 Meat<br />
During the period under review, the country produced 408 MT <strong>of</strong> meat worth Kshs. 162.3 billion (Table 5.7) Beef<br />
production was the main meat produced whose value also registered an increase in 2014 compared with 2013. Other<br />
types <strong>of</strong> meat such as chevon, mutton, pork, rabbit meat, poultry meat and camel meat indicated an upward trend.<br />
Poultry production increased in 2014 due to increased demand in major towns.<br />
Table 5.7: Meat Production<br />
Products (MT) 2012 2013 2014<br />
Quantity<br />
Total value<br />
(Kshs Million)<br />
Quantity<br />
Total value<br />
(Kshs Million)<br />
Quantity<br />
Total value<br />
(Kshs Million)<br />
Beef 94,823.6 37,929.4 96,764.5 38,705.8 113,450.3 45,380.1<br />
Chevon 20,561.3 8,224.5 45,311.7 18,124.7 68,190.6 27,276.2<br />
Mutton 14,149.2 5,659.7 21,852.1 8,740.8 91,589.6 36,635.8<br />
Pork 17,590.7 7,036.3 8,159.9 3,263.9 42,804.3 17,121.7<br />
Rabbit 233.6 93.4 321.6 128.7 348.4 139.4<br />
Poultry 48,393.0 19,357.2 28,692.5 11,477.0 81,042.7 32,417.1<br />
Camel 9,085.5 2,725.6 8,855.8 2,656.7 11,220.6 3,366.2<br />
Total 204,836.8 81,026.2 209,958.1 83,097.6 408,646.5 162,336.5<br />
Source: SDL<br />
5.2.3 Other Products<br />
Other livestock products such as eggs, honey, wax, wool, hides and skins experienced a slight increase in their<br />
production and values in 2014 when compared with 2013 (Table 5.8).<br />
Table 5.8: Other livestock products<br />
Products 2012 2013 2014<br />
Quantity Total value (Kshs) Quantity Total value (Kshs) Quantity Total value (Kshs)<br />
Eggs (No. 197,062,582 59,118,774,730 170,213,441 51,064,032,250 171,183,941 51,355,182,240<br />
<strong>of</strong> trays)<br />
Honey(Kg) 8,740,524 4,370,262,026 8,249,905 4,124,952,676 29,742,670 14,871,335,063<br />
Wax (Kg) 947,365 757,892,160 749,963 599,970,533 736,210 588,967,613<br />
Hides (No.) 41,266 4,126,600 112,885 11,288,500 923,536 92,353,600<br />
Skins (No.) 307,484 15,374,200 646,666 32,333,300 1,388,149 69,407,450<br />
Source: SDL<br />
<strong>Economic</strong> <strong>Review</strong> <strong>of</strong> <strong>Agriculture</strong> [ERA] <strong>2015</strong> 39