Economic-Review-of-Agriculture_2015-6
Economic-Review-of-Agriculture_2015-6
Economic-Review-of-Agriculture_2015-6
You also want an ePaper? Increase the reach of your titles
YUMPU automatically turns print PDFs into web optimized ePapers that Google loves.
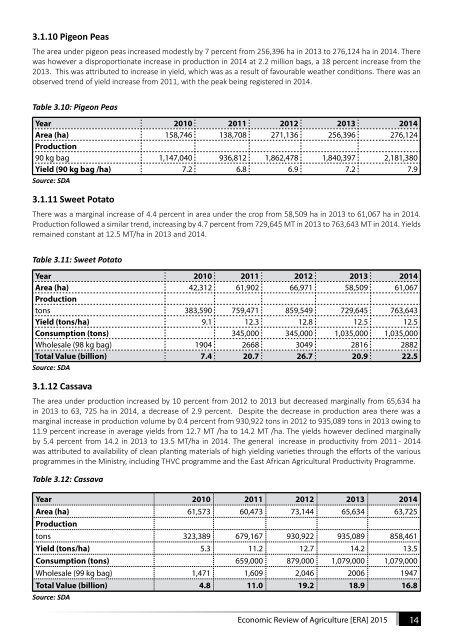
3.1.10 Pigeon Peas<br />
The area under pigeon peas increased modestly by 7 percent from 256,396 ha in 2013 to 276,124 ha in 2014. There<br />
was however a disproportionate increase in production in 2014 at 2.2 million bags, a 18 percent increase from the<br />
2013. This was attributed to increase in yield, which was as a result <strong>of</strong> favourable weather conditions. There was an<br />
observed trend <strong>of</strong> yield increase from 2011, with the peak being registered in 2014.<br />
Table 3.10: Pigeon Peas<br />
Year 2010 2011 2012 2013 2014<br />
Area (ha) 158,746 138,708 271,136 256,396 276,124<br />
Production<br />
90 kg bag 1,147,040 936,812 1,862,478 1,840,397 2,181,380<br />
Yield (90 kg bag /ha) 7.2 6.8 6.9 7.2 7.9<br />
Source: SDA<br />
3.1.11 Sweet Potato<br />
There was a marginal increase <strong>of</strong> 4.4 percent in area under the crop from 58,509 ha in 2013 to 61,067 ha in 2014.<br />
Production followed a similar trend, increasing by 4.7 percent from 729,645 MT in 2013 to 763,643 MT in 2014. Yields<br />
remained constant at 12.5 MT/ha in 2013 and 2014.<br />
Table 3.11: Sweet Potato<br />
Year 2010 2011 2012 2013 2014<br />
Area (ha) 42,312 61,902 66,971 58,509 61,067<br />
Production<br />
tons 383,590 759,471 859,549 729,645 763,643<br />
Yield (tons/ha) 9.1 12.3 12.8 12.5 12.5<br />
Consumption (tons) 345,000 345,000 1,035,000 1,035,000<br />
Wholesale (98 kg bag) 1904 2668 3049 2816 2882<br />
Total Value (billion) 7.4 20.7 26.7 20.9 22.5<br />
Source: SDA<br />
3.1.12 Cassava<br />
The area under production increased by 10 percent from 2012 to 2013 but decreased marginally from 65,634 ha<br />
in 2013 to 63, 725 ha in 2014, a decrease <strong>of</strong> 2.9 percent. Despite the decrease in production area there was a<br />
marginal increase in production volume by 0.4 percent from 930,922 tons in 2012 to 935,089 tons in 2013 owing to<br />
11.9 percent increase in average yields from 12.7 MT /ha to 14.2 MT /ha. The yields however declined marginally<br />
by 5.4 percent from 14.2 in 2013 to 13.5 MT/ha in 2014. The general increase in productivity from 2011 - 2014<br />
was attributed to availability <strong>of</strong> clean planting materials <strong>of</strong> high yielding varieties through the efforts <strong>of</strong> the various<br />
programmes in the Ministry, including THVC programme and the East African Agricultural Productivity Programme.<br />
Table 3.12: Cassava<br />
Year 2010 2011 2012 2013 2014<br />
Area (ha) 61,573 60,473 73,144 65,634 63,725<br />
Production<br />
tons 323,389 679,167 930,922 935,089 858,461<br />
Yield (tons/ha) 5.3 11.2 12.7 14.2 13.5<br />
Consumption (tons) 659,000 879,000 1,079,000 1,079,000<br />
Wholesale (99 kg bag) 1,471 1,609 2,046 2006 1947<br />
Total Value (billion) 4.8 11.0 19.2 18.9 16.8<br />
Source: SDA<br />
<strong>Economic</strong> <strong>Review</strong> <strong>of</strong> <strong>Agriculture</strong> [ERA] <strong>2015</strong> 14


