

Economic-Review-of-Agriculture_2015-6
Economic-Review-of-Agriculture_2015-6
Economic-Review-of-Agriculture_2015-6

Create successful ePaper yourself
Turn your PDF publications into a flip-book with our unique Google optimized e-Paper software.
2.0 WORLD COMMODITY SITUATION<br />
2.1 Cereals<br />
According to FAO, world cereal production in 2014 was 2,523 million tons, 4.8 million tones lower than what was<br />
recorded in 2013. Wheat production achieved a new record, at 718.5 million tons, and coarse grains recorded a slight<br />
decline to 1,308 million tons. Unfavorable weather conditions lowered prospects for rice production, which recorded<br />
at 496.4 million tons, a decline <strong>of</strong> 0.4 percent compared to 2013 production.<br />
Word cereal utilization in 2014 was recorded at 2,461.3 million tones. This was a growth <strong>of</strong> 2.2 percent (53.5 million<br />
tons) compared to 2013. Based on the latest forecasts for production and utilization, world cereal stocks at the close<br />
<strong>of</strong> the year increased to 627.5 million tons, up from 579.5 recorded at the close <strong>of</strong> 2013. Maize accounted for the<br />
biggest increase, followed by wheat, while rice stocks declined. The overall positive result in the cereal stocks-to-use<br />
ratio increased to 25.2 percent in 2014 from 23.5 percent in 2013, which was the highest since 2001.<br />
Abundant supplies recorded in 2014 resulted in sharp decline in international prices <strong>of</strong> all cereals, with the exception<br />
<strong>of</strong> rice. However, the lower prices did not stimulate trade, as the major cereal importing countries held large supplies,<br />
resulting in depressed import demand. As a result, total cereal trade contracted by 5.0 percent to 337 million tons in<br />
2014.<br />
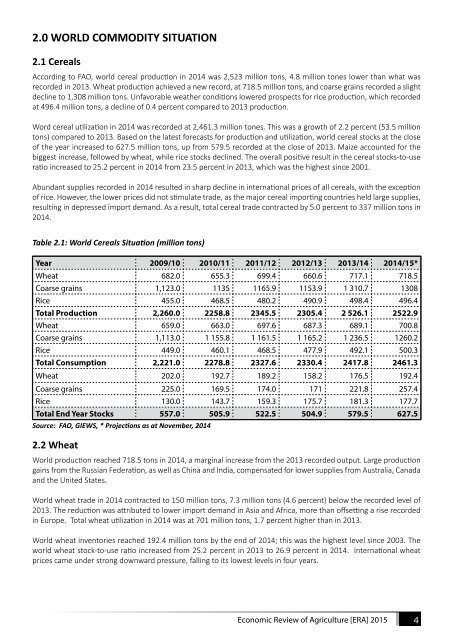
Table 2.1: World Cereals Situation (million tons)<br />
Year 2009/10 2010/11 2011/12 2012/13 2013/14 2014/15*<br />
Wheat 682.0 655.3 699.4 660.6 717.1 718.5<br />
Coarse grains 1,123.0 1135 1165.9 1153.9 1 310.7 1308<br />
Rice 455.0 468.5 480.2 490.9 498.4 496.4<br />
Total Production 2,260.0 2258.8 2345.5 2305.4 2 526.1 2522.9<br />
Wheat 659.0 663.0 697.6 687.3 689.1 700.8<br />
Coarse grains 1,113.0 1 155.8 1 161.5 1 165.2 1 236.5 1260.2<br />
Rice 449.0 460.1 468.5 477.9 492.1 500.3<br />
Total Consumption 2,221.0 2278.8 2327.6 2330.4 2417.8 2461.3<br />
Wheat 202.0 192.7 189.2 158.2 176.5 192.4<br />
Coarse grains 225.0 169.5 174.0 171 221.8 257.4<br />
Rice 130.0 143.7 159.3 175.7 181.3 177.7<br />
Total End Year Stocks 557.0 505.9 522.5 504.9 579.5 627.5<br />
Source: FAO, GIEWS, * Projections as at November, 2014<br />
2.2 Wheat<br />
World production reached 718.5 tons in 2014, a marginal increase from the 2013 recorded output. Large production<br />
gains from the Russian Federation, as well as China and India, compensated for lower supplies from Australia, Canada<br />
and the United States.<br />
World wheat trade in 2014 contracted to 150 million tons, 7.3 million tons (4.6 percent) below the recorded level <strong>of</strong><br />
2013. The reduction was attributed to lower import demand in Asia and Africa, more than <strong>of</strong>fsetting a rise recorded<br />
in Europe. Total wheat utilization in 2014 was at 701 million tons, 1.7 percent higher than in 2013.<br />
World wheat inventories reached 192.4 million tons by the end <strong>of</strong> 2014; this was the highest level since 2003. The<br />
world wheat stock-to-use ratio increased from 25.2 percent in 2013 to 26.9 percent in 2014. International wheat<br />
prices came under strong downward pressure, falling to its lowest levels in four years.<br />
<strong>Economic</strong> <strong>Review</strong> <strong>of</strong> <strong>Agriculture</strong> [ERA] <strong>2015</strong> 4