

Economic-Review-of-Agriculture_2015-6
Economic-Review-of-Agriculture_2015-6
Economic-Review-of-Agriculture_2015-6

Create successful ePaper yourself
Turn your PDF publications into a flip-book with our unique Google optimized e-Paper software.
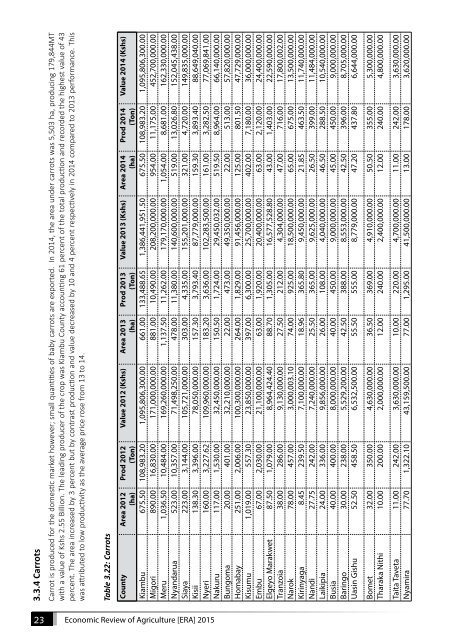
3.3.4 Carrots<br />
Carrot is produced for the domestic market however; small quantities <strong>of</strong> baby carrots are exported. In 2014, the area under carrots was 5,503 ha, producing 179,844MT<br />
with a value <strong>of</strong> Kshs 2.55 Billion. The leading producer <strong>of</strong> the crop was Kiambu County accounting 61 percent <strong>of</strong> the total production and recorded the highest value <strong>of</strong> 43<br />
percent. The area increased by 3 percent but by contrast production and value decreased by 10 and 4 percent respectively in 2014 compared to 2013 performance. This<br />
was attributed to low productivity as the average price rose from 13 to 14.<br />
Table 3.22: Carrots<br />
County Area 2012<br />
(ha)<br />
Prod 2012<br />
(Ton)<br />
Value 2012 (Kshs) Area 2013<br />
(ha)<br />
Prod 2013<br />
(Ton)<br />
Value 2013 (Kshs) Area 2014<br />
(ha)<br />
Prod 2014<br />
(Ton)<br />
Value 2014 (Kshs)<br />
Kiambu 675.50 108,983.20 1,095,806,300.00 661.00 133,488.65 1,386,441,951.50 675.50 108,983.20 1,095,806,300.00<br />
Migori 890.00 16,830.00 171,000,000.00 881.00 10,490.00 208,200,000.00 954.00 11,175.00 452,700,000.00<br />
Meru 1,036.50 10,484.00 169,260,000.00 1,137.50 11,262.00 179,170,000.00 1,054.00 8,681.00 162,330,000.00<br />
Nyandarua 523.00 10,357.00 71,498,250.00 478.00 11,380.00 140,600,000.00 519.00 13,026.80 152,045,438.00<br />
Siaya 223.00 3,144.00 105,721,000.00 303.00 4,335.00 155,201,000.00 321.00 4,720.00 149,835,000.00<br />
Kisii 138.30 3,396.00 78,050,000.00 157.30 3,793.40 87,779,000.00 159.30 3,893.40 88,649,040.00<br />
Nyeri 160.00 3,227.62 109,960,000.00 183.20 3,636.00 102,283,500.00 161.00 3,282.50 77,069,841.00<br />
Nakuru 117.00 1,530.00 32,450,000.00 150.50 1,724.00 29,450,032.00 519.50 8,964.00 66,140,000.00<br />
Bungoma 20.00 401.00 32,210,000.00 22.00 473.00 49,350,000.00 22.00 513.00 57,820,000.00<br />
Homabay 251.00 2,006.00 100,300,000.00 264.00 1,829.00 91,456,000.00 125.00 801.50 47,729,000.00<br />
Kisumu 1,019.00 557.30 23,850,000.00 397.00 6,300.00 25,700,000.00 402.00 7,180.00 36,000,000.00<br />
Embu 67.00 2,030.00 21,100,000.00 63.00 1,920.00 20,400,000.00 63.00 2,120.00 24,400,000.00<br />
Elgeyo Marakwet 87.50 1,079.00 8,964,424.40 88.70 1,305.00 16,577,528.80 43.00 1,403.00 22,590,000.00<br />
Tranzoia 38.00 286.00 9,130,000.00 27.50 212.00 4,304,000.00 47.00 716.00 17,800,002.00<br />
Narok 78.00 457.00 3,000,003.10 74.00 925.00 18,500,000.00 65.00 675.00 13,500,000.00<br />
Kirinyaga 8.45 239.50 7,100,000.00 18.96 365.80 9,450,000.00 21.85 463.50 11,740,000.00<br />
Nandi 27.75 242.00 7,240,000.00 25.50 365.00 9,625,000.00 26.50 399.00 11,484,000.00<br />
Laikipia 24.00 336.00 9,856,000.00 26.00 108.00 4,040,000.00 46.50 288.50 10,540,000.00<br />
Busia 40.00 400.00 8,000,000.00 40.00 450.00 9,000,000.00 45.00 450.00 9,000,000.00<br />
Baringo 30.00 238.00 5,529,200.00 42.50 388.00 8,553,000.00 42.50 396.00 8,705,000.00<br />
Uasin Gishu 52.50 458.50 6,532,500.00 55.50 555.00 8,779,000.00 47.20 437.80 6,644,000.00<br />
Bomet 32.00 350.00 4,630,000.00 36.50 369.00 4,910,000.00 50.50 355.00 5,300,000.00<br />
Tharaka Nithi 10.00 200.00 2,000,000.00 12.00 240.00 2,400,000.00 12.00 240.00 4,800,000.00<br />
Taita Taveta 11.00 242.00 3,630,000.00 10.00 220.00 4,700,000.00 11.00 242.00 3,630,000.00<br />
Nyamira 77.70 1,322.10 43,159,500.00 77.00 1,295.00 41,500,000.00 13.00 178.00 3,620,000.00<br />
23<br />
<strong>Economic</strong> <strong>Review</strong> <strong>of</strong> <strong>Agriculture</strong> [ERA] <strong>2015</strong>