

Economic-Review-of-Agriculture_2015-6
Economic-Review-of-Agriculture_2015-6
Economic-Review-of-Agriculture_2015-6

You also want an ePaper? Increase the reach of your titles
YUMPU automatically turns print PDFs into web optimized ePapers that Google loves.
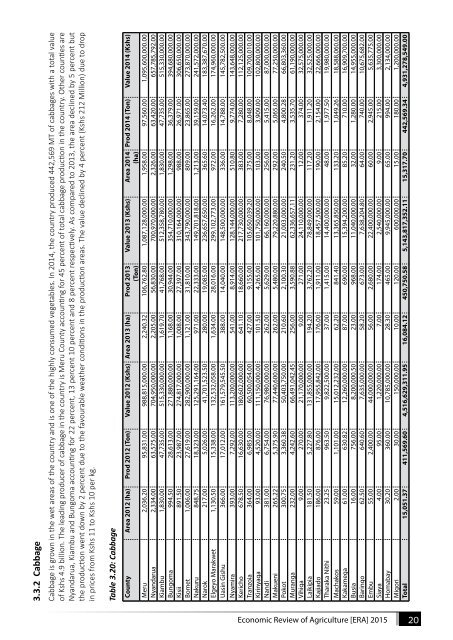
3.3.2 Cabbage<br />
Cabbage is grown in the wet areas <strong>of</strong> the country and is one <strong>of</strong> the highly consumed vegetables. In 2014, the country produced 442,569 MT <strong>of</strong> cabbages with a total value<br />
<strong>of</strong> Kshs 4.9 billion. The leading producer <strong>of</strong> cabbage in the country is Meru County accounting for 45 percent <strong>of</strong> total cabbage production in the country. Other counties are<br />
Nyandarua, Kiambu and Bungoma accounting for 22 percent, 13 percent 10 percent and 8 percent respectively. As compared to 2013, the area declined by 5 percent but<br />
the production went down by 2 percent due to the favourable weather conditions in the production areas. The value declined by 4 percent (Kshs 212 Million) due to drop<br />
in prices from Kshs 11 to Kshs 10 per kg.<br />
Table 3.20: Cabbage<br />
County Area 2012 (ha) Prod 2012 (Ton) Value 2012 (Kshs) Area 2013 (ha) Prod 2013<br />
(Ton)<br />
Value 2013 (Kshs) Area 2014<br />
(ha)<br />
Prod 2014 (Ton) Value 2014 (Kshs)<br />
Meru 2,036.20 95,831.00 988,815,000.00 2,240.32 106,762.80 1,087,128,000.00 1,958.00 97,560.00 1,095,600,000.00<br />
Nyandarua 2,334.00 63,575.00 704,950,000.00 2,205.00 56,830.00 700,970,000.00 2,326.00 63,420.00 657,785,792.00<br />
Kiambu 1,830.00 47,735.00 515,330,000.00 1,619.70 41,768.00 512,358,780.00 1,830.00 47,735.00 515,330,000.00<br />
Bungoma 994.50 28,613.00 271,880,000.00 1,168.00 30,944.00 354,710,000.00 1,298.00 36,379.00 394,680,000.00<br />
Kisii 891.50 23,987.00 274,817,000.00 1,008.00 27,397.00 310,164,000.00 988.00 26,971.00 306,650,000.00<br />
Bomet 1,006.00 27,619.00 282,900,000.00 1,121.00 31,810.00 343,790,000.00 809.00 23,865.00 273,870,000.00<br />
Nakuru 848.75 18,323.00 125,291,164.00 971.00 22,333.00 149,701,818.00 1,213.00 39,159.00 241,572,000.00<br />
Narok 217.00 5,026.00 41,701,523.50 280.00 19,085.00 236,657,650.00 365.60 14,073.40 183,387,670.00<br />
Elgeyo Marakwet 1,130.50 15,338.00 132,532,058.00 1,634.00 28,016.00 299,102,773.00 972.00 16,262.00 174,960,000.00<br />
Uasin Gishu 366.00 17,012.00 161,579,545.50 388.00 14,040.00 148,500,000.00 336.00 14,788.00 145,782,500.00<br />
Nyamira 393.00 7,292.00 113,200,000.00 541.00 8,914.00 128,144,000.00 510.80 9,774.00 143,648,000.00<br />
Kericho 678.50 16,630.00 180,602,000.00 641.10 18,660.00 217,730,000.00 383.00 7,280.00 112,125,000.00<br />
Tranzoia 364.00 6,985.00 60,500,054.00 427.00 9,155.00 105,650,039.20 375.00 8,048.00 109,700,010.00<br />
Kirinyaga 93.00 4,520.00 111,150,000.00 101.50 4,265.00 101,750,000.00 103.00 3,909.00 102,800,000.00<br />
Nandi 381.00 6,754.00 76,980,000.00 262.00 5,629.00 66,160,000.00 256.00 5,415.00 87,000,000.00<br />
Makueni 265.22 5,375.90 77,440,600.00 262.00 5,480.00 79,220,880.00 292.00 5,065.00 77,250,000.00<br />
Pokot 300.75 3,360.38 50,403,750.00 210.60 2,100.30 21,003,000.00 240.50 4,800.28 66,803,360.00<br />
Muranga 232.00 4,242.60 66,491,042.45 256.00 3,590.88 62,336,657.11 231.20 3,535.70 61,190,000.00<br />
Vihiga 9.00 270.00 21,170,000.00 9.00 271.00 24,110,000.00 12.00 374.00 32,575,000.00<br />
Laikipia 181.50 5,227.80 131,855,000.00 194.20 3,762.20 78,849,000.00 117.20 1,911.20 32,525,000.00<br />
Kajiado 186.00 876.00 17,955,842.00 176.00 1,911.00 18,457,500.00 190.00 2,154.00 22,666,000.00<br />
Tharaka Nithi 23.25 963.50 9,822,500.00 37.00 1,415.00 14,400,000.00 48.00 1,977.50 19,980,000.00<br />
Machakos 59.00 1,101.00 15,012,232.00 62.20 841.40 13,365,850.00 133.20 1,049.26 18,588,060.00<br />
Kakamega 61.00 630.82 12,260,000.00 87.00 690.00 15,394,200.00 85.20 710.00 16,909,700.00<br />
Busia 16.00 756.00 8,200,000.50 23.00 968.00 11,040,000.00 32.00 1,280.00 14,955,000.00<br />
Baringo 62.50 640.60 7,635,000.00 58.20 673.00 7,638,204.80 64.00 740.00 10,675,682.00<br />
Embu 55.00 2,400.00 44,000,000.00 56.00 2,680.00 22,400,000.00 60.00 2,945.00 5,635,775.00<br />
Siaya 4.00 95.00 1,220,000.00 7.00 174.00 2,540,000.00 9.00 215.00 3,300,000.00<br />
Homabay 30.20 360.00 10,785,000.00 28.30 465.00 9,945,000.00 65.00 994.00 2,134,000.00<br />
Migori 2.00 30.00 150,000.00 10.00 120.00 600,000.00 15.00 180.00 1,200,000.00<br />
Total 15,051.37 411,569.60 4,516,629,311.95 16,084.12 450,750.58 5,143,817,352.11 15,317.70 442,569.34 4,931,278,549.00<br />
<strong>Economic</strong> <strong>Review</strong> <strong>of</strong> <strong>Agriculture</strong> [ERA] <strong>2015</strong> 20