

Economic-Review-of-Agriculture_2015-6
Economic-Review-of-Agriculture_2015-6
Economic-Review-of-Agriculture_2015-6

Create successful ePaper yourself
Turn your PDF publications into a flip-book with our unique Google optimized e-Paper software.
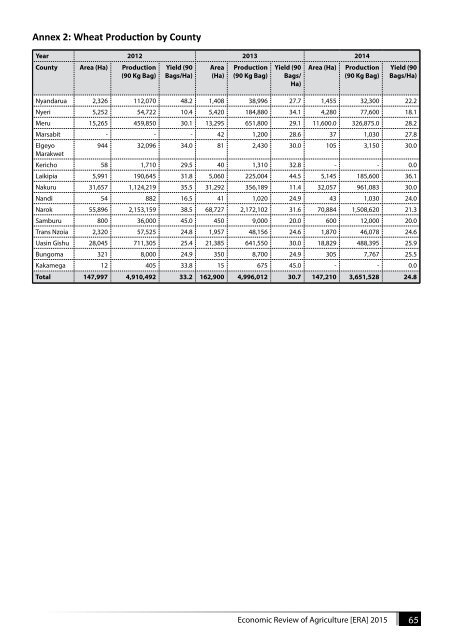
Annex 2: Wheat Production by County<br />
Year 2012 2013 2014<br />
County Area (Ha) Production<br />
(90 Kg Bag)<br />
Yield (90<br />
Bags/Ha)<br />
Area<br />
(Ha)<br />
Production<br />
(90 Kg Bag)<br />
Yield (90<br />
Bags/<br />
Ha)<br />
Area (Ha)<br />
Production<br />
(90 Kg Bag)<br />
Yield (90<br />
Bags/Ha)<br />
Nyandarua 2,326 112,070 48.2 1,408 38,996 27.7 1,455 32,300 22.2<br />
Nyeri 5,252 54,722 10.4 5,420 184,880 34.1 4,280 77,600 18.1<br />
Meru 15,265 459,850 30.1 13,295 651,800 29.1 11,600.0 326,875.0 28.2<br />
Marsabit - - - 42 1,200 28.6 37 1,030 27.8<br />
Elgeyo<br />
944 32,096 34.0 81 2,430 30.0 105 3,150 30.0<br />
Marakwet<br />
Kericho 58 1,710 29.5 40 1,310 32.8 - - 0.0<br />
Laikipia 5,991 190,645 31.8 5,060 225,004 44.5 5,145 185,600 36.1<br />
Nakuru 31,657 1,124,219 35.5 31,292 356,189 11.4 32,057 961,083 30.0<br />
Nandi 54 882 16.5 41 1,020 24.9 43 1,030 24.0<br />
Narok 55,896 2,153,159 38.5 68,727 2,172,102 31.6 70,884 1,508,620 21.3<br />
Samburu 800 36,000 45.0 450 9,000 20.0 600 12,000 20.0<br />
Trans Nzoia 2,320 57,525 24.8 1,957 48,156 24.6 1,870 46,078 24.6<br />
Uasin Gishu 28,045 711,305 25.4 21,385 641,550 30.0 18,829 488,395 25.9<br />
Bungoma 321 8,000 24.9 350 8,700 24.9 305 7,767 25.5<br />
Kakamega 12 405 33.8 15 675 45.0 - - 0.0<br />
Total 147,997 4,910,492 33.2 162,900 4,996,012 30.7 147,210 3,651,528 24.8<br />
<strong>Economic</strong> <strong>Review</strong> <strong>of</strong> <strong>Agriculture</strong> [ERA] <strong>2015</strong> 65