

Economic-Review-of-Agriculture_2015-6
Economic-Review-of-Agriculture_2015-6
Economic-Review-of-Agriculture_2015-6

You also want an ePaper? Increase the reach of your titles
YUMPU automatically turns print PDFs into web optimized ePapers that Google loves.
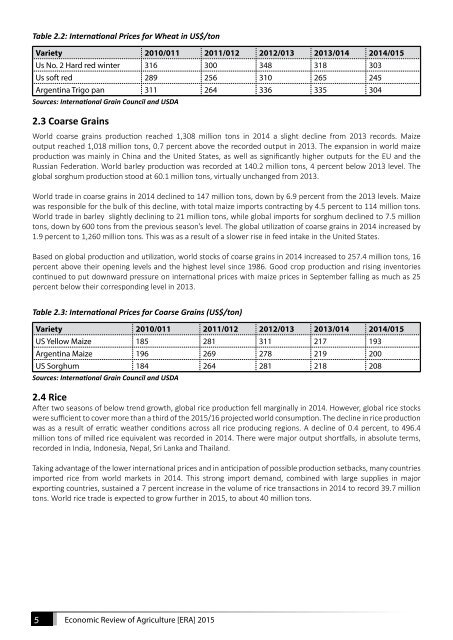
Table 2.2: International Prices for Wheat in US$/ton<br />
Variety 2010/011 2011/012 2012/013 2013/014 2014/015<br />
Us No. 2 Hard red winter 316 300 348 318 303<br />
Us s<strong>of</strong>t red 289 256 310 265 245<br />
Argentina Trigo pan 311 264 336 335 304<br />
Sources: International Grain Council and USDA<br />
2.3 Coarse Grains<br />
World coarse grains production reached 1,308 million tons in 2014 a slight decline from 2013 records. Maize<br />
output reached 1,018 million tons, 0.7 percent above the recorded output in 2013. The expansion in world maize<br />
production was mainly in China and the United States, as well as significantly higher outputs for the EU and the<br />
Russian Federation. World barley production was recorded at 140.2 million tons, 4 percent below 2013 level. The<br />
global sorghum production stood at 60.1 million tons, virtually unchanged from 2013.<br />
World trade in coarse grains in 2014 declined to 147 million tons, down by 6.9 percent from the 2013 levels. Maize<br />
was responsible for the bulk <strong>of</strong> this decline, with total maize imports contracting by 4.5 percent to 114 million tons.<br />
World trade in barley slightly declining to 21 million tons, while global imports for sorghum declined to 7.5 million<br />
tons, down by 600 tons from the previous season’s level. The global utilization <strong>of</strong> coarse grains in 2014 increased by<br />
1.9 percent to 1,260 million tons. This was as a result <strong>of</strong> a slower rise in feed intake in the United States.<br />
Based on global production and utilization, world stocks <strong>of</strong> coarse grains in 2014 increased to 257.4 million tons, 16<br />
percent above their opening levels and the highest level since 1986. Good crop production and rising inventories<br />
continued to put downward pressure on international prices with maize prices in September falling as much as 25<br />
percent below their corresponding level in 2013.<br />
Table 2.3: International Prices for Coarse Grains (US$/ton)<br />
Variety 2010/011 2011/012 2012/013 2013/014 2014/015<br />
US Yellow Maize 185 281 311 217 193<br />
Argentina Maize 196 269 278 219 200<br />
US Sorghum 184 264 281 218 208<br />
Sources: International Grain Council and USDA<br />
2.4 Rice<br />
After two seasons <strong>of</strong> below trend growth, global rice production fell marginally in 2014. However, global rice stocks<br />
were sufficient to cover more than a third <strong>of</strong> the <strong>2015</strong>/16 projected world consumption. The decline in rice production<br />
was as a result <strong>of</strong> erratic weather conditions across all rice producing regions. A decline <strong>of</strong> 0.4 percent, to 496.4<br />
million tons <strong>of</strong> milled rice equivalent was recorded in 2014. There were major output shortfalls, in absolute terms,<br />
recorded in India, Indonesia, Nepal, Sri Lanka and Thailand.<br />
Taking advantage <strong>of</strong> the lower international prices and in anticipation <strong>of</strong> possible production setbacks, many countries<br />
imported rice from world markets in 2014. This strong import demand, combined with large supplies in major<br />
exporting countries, sustained a 7 percent increase in the volume <strong>of</strong> rice transactions in 2014 to record 39.7 million<br />
tons. World rice trade is expected to grow further in <strong>2015</strong>, to about 40 million tons.<br />
5<br />
<strong>Economic</strong> <strong>Review</strong> <strong>of</strong> <strong>Agriculture</strong> [ERA] <strong>2015</strong>