

Economic-Review-of-Agriculture_2015-6
Economic-Review-of-Agriculture_2015-6
Economic-Review-of-Agriculture_2015-6

Create successful ePaper yourself
Turn your PDF publications into a flip-book with our unique Google optimized e-Paper software.
Global potash exports from producing countries totaled approximately 53 million tons in 2014 as significant market<br />
uncertainty during the second half <strong>of</strong> the year impacted negatively on demand. It is estimated that global consumption<br />
exceeded shipments for the second consecutive year as usage <strong>of</strong> the fertilizer for agriculture was not affected by<br />
uncertainty in market conditions that prevailed.<br />
With low global opening inventories and higher projected consumption, global exports increased in 2014. Demand<br />
in the first half <strong>of</strong> the year was particularly robust, increasing by more than 10 percent compared to first-half <strong>of</strong> 2013<br />
to approximately 32.5 million tons. With an expectation <strong>of</strong> strong demand through the balance <strong>of</strong> the year, it was<br />
expected that exports in 2014 would surpass the previous record and reach more than 58 million tons.<br />
Global demand for nitrogen grew at a historically consistent rate, this was caused by strong demand from the US,<br />
Latin America and India. However, export supply had been more unpredictable, which has contributed to volatile<br />
nitrogen markets in recent years.<br />
Ammonia production from the Former Soviet Union (FSU) countries was relatively stable over the previous three<br />
years. This was supported by strong global markets. Russia and Ukraine were the largest producers <strong>of</strong> ammonia,<br />
accounting for 66 percent and 20 percent, respectively, <strong>of</strong> the regional total.<br />
During the period under review, Ukrainian production was affected by political tension, uncertain natural gas supply<br />
and pricing terms. The country’s production was estimated to have dropped to approximately 50 percent <strong>of</strong> typical<br />
levels. However, ammonia production in Russia was not significantly impacted by regional tensions or trade sanctions.<br />
2.9 World Fish Production Situation<br />
Global fish production grew steadily in the previous five decades from a low <strong>of</strong> 20 million tonnes in 1950 to 165.9<br />
million tonnes in 2014 (Table 2.8). World per capita apparent fish consumption increased from an average <strong>of</strong> 9.9<br />
kg in the 1960s to 20.0 kg in 2014. This impressive development has been driven by a combination <strong>of</strong> population<br />
growth, rising incomes and urbanization, and facilitated by the strong expansion <strong>of</strong> fish production and more efficient<br />
distribution channels.<br />
Total global capture production from both inland and marine <strong>of</strong> 93.7 million tonnes in 2011 was the second-highest<br />
ever, slightly below the 93.8 million tonnes <strong>of</strong> 1996. The year 2013 had a new maximum production <strong>of</strong> 92.4 million<br />
tonnes while in 2014 the production declined slightly by 0.4 percent to 92.0 million tonnes.<br />
World aquaculture production continued to grow, albeit at a slowing rate. According to the latest available statistics<br />
collected globally by FAO, world aquaculture production attained another all-time high <strong>of</strong> 73.9 million tonnes <strong>of</strong><br />
food fish in 2014 a growth <strong>of</strong> 4.9 percent from 70.5 million tonnes in 2013. The term “food fish” includes finfishes,<br />
crustaceans, molluscs, amphibians, freshwater turtles and other aquatic animals (such as sea cucumbers, sea urchins,<br />
sea squirts and edible jellyfish) produced for the intended use as food for human consumption. The global trend<br />
<strong>of</strong> aquaculture development gaining importance in total fish supply remained uninterrupted. Farmed food fish<br />
contributed 44.5 percent <strong>of</strong> the total 165.9 million tonnes <strong>of</strong> fish produced by capture fisheries and aquaculture in<br />
2014.<br />
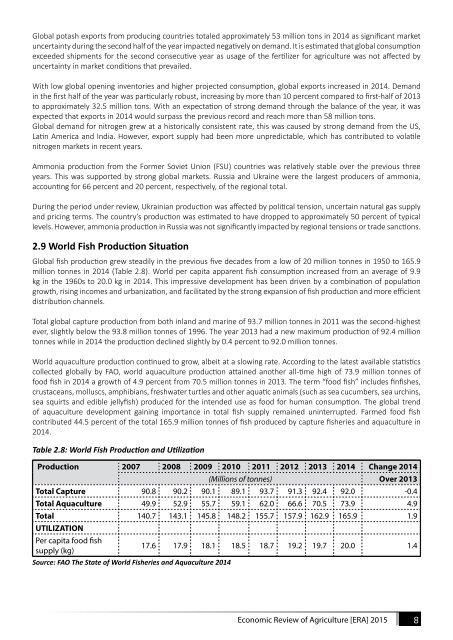
Table 2.8: World Fish Production and Utilization<br />
Production 2007 2008 2009 2010 2011 2012 2013 2014 Change 2014<br />
(Millions <strong>of</strong> tonnes) Over 2013<br />
Total Capture 90.8 90.2 90.1 89.1 93.7 91.3 92.4 92.0 -0.4<br />
Total Aquaculture 49.9 52.9 55.7 59.1 62.0 66.6 70.5 73.9 4.9<br />
Total 140.7 143.1 145.8 148.2 155.7 157.9 162.9 165.9 1.9<br />
UTILIZATION<br />
Per capita food fish<br />
supply (kg)<br />
17.6 17.9 18.1 18.5 18.7 19.2 19.7 20.0 1.4<br />
Source: FAO The State <strong>of</strong> World Fisheries and Aquaculture 2014<br />
<strong>Economic</strong> <strong>Review</strong> <strong>of</strong> <strong>Agriculture</strong> [ERA] <strong>2015</strong> 8