

Economic-Review-of-Agriculture_2015-6
Economic-Review-of-Agriculture_2015-6
Economic-Review-of-Agriculture_2015-6

Create successful ePaper yourself
Turn your PDF publications into a flip-book with our unique Google optimized e-Paper software.
2.7 C<strong>of</strong>fee<br />
Global c<strong>of</strong>fee production in 2013/014 was estimated at 8.52 million tons compared to 8.80 million tons recorded<br />
in 2012/013. This represented a 3.2 percent reduction which was as a result <strong>of</strong> outbreak <strong>of</strong> c<strong>of</strong>fee leaf rust disease<br />
in some major c<strong>of</strong>fee growing countries in Central America. Prospects for 2014/015 are not so good as a result <strong>of</strong><br />
drought in Brazil and lower output in Indonesia.<br />
Production in Africa fell slightly to 0.962 million tons, or 11.3 percent <strong>of</strong> the world total production. Ethiopia recorded<br />
the largest production in the region, at 0.39 million tons, followed by Uganda at 0.222 million tons and Côte d’Ivoire<br />
0.114 million tons. Kenya production was relatively unchanged at 0.051 million tons.<br />
Total demand in calendar year 2013 was estimated at 8.766 million tons, and a growth <strong>of</strong> 2.1percent per annum was<br />
recorded over the preceding four years. This growth was mostly driven by increased demand in exporting countries<br />
and new consuming countries, which have registered an average annual growth rate <strong>of</strong> 3.1percent and 2.7percent<br />
respectively since 2010.<br />
After declining almost continuously in 2011/12 and 2012/13, c<strong>of</strong>fee prices recovered strongly in 2013/14. Early in<br />
the year, Brazil suffered one <strong>of</strong> its worst droughts on record, leading the International C<strong>of</strong>fee Organization (ICO)<br />
composite price to soar from under US$ 2/kg in mid-November 2013 to a high <strong>of</strong> US$ 3.6 in April 2014. The ICO<br />
composite price for the year 2013/14 averaged US$ 2.82/kg.<br />
C<strong>of</strong>fee stocks and inventories were mostly higher in 2013/14 compared to previous seasons. Stocks in c<strong>of</strong>fee producing<br />
countries increased from 1.281 to 1.36 million tons at the end <strong>of</strong> the crop year, due to good stocks held by Brazil and<br />
Vietnam. Importing countries also replenished their c<strong>of</strong>fee inventories, up to 1.398 million tons by September 2014,<br />
from 1.26 million tons in September 2013.<br />
Table 2.7: C<strong>of</strong>fee Production by Exporting Countries<br />
Production 2008/09 2009/10 2010/11 2011/12 2012/13 2013/14*<br />
Total Production by exporting<br />
7.4 8.03 7.93 8.06 8.80 8.52<br />
countries (Million tons)<br />
Production in Kenya(Million tons) 0.0378 0.03846 0.04542 0.0525 0.05178 0.051<br />
Average composite prices (Kshs./ton) 201,265.8 256,197.6 366,078.6 272,031.6 250,947.4 279,468<br />
Source: International C<strong>of</strong>fee Organization * Projections<br />
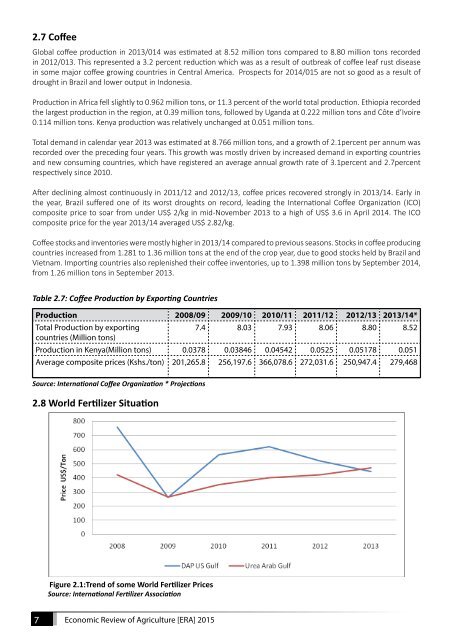
2.8 World Fertilizer Situation<br />
Figure 2.1:Trend <strong>of</strong> some World Fertilizer Prices<br />
Source: International Fertilizer Association<br />
7<br />
<strong>Economic</strong> <strong>Review</strong> <strong>of</strong> <strong>Agriculture</strong> [ERA] <strong>2015</strong>