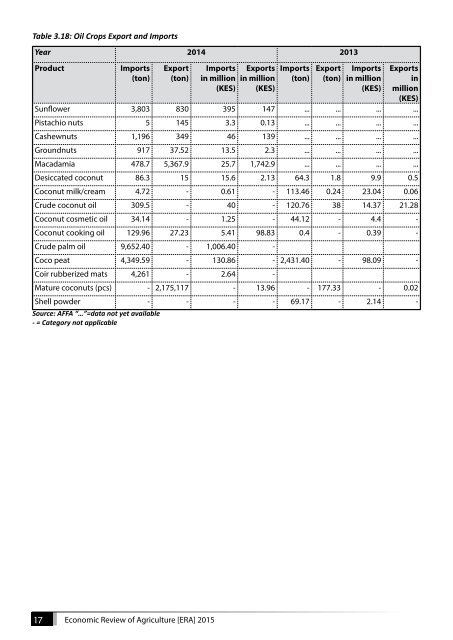
Table 3.18: Oil Crops Export and Imports Year 2014 2013 Product Imports Export Imports Exports Imports Export Imports Exports (ton) (ton) in million (KES) in million (KES) (ton) (ton) in million (KES) in million (KES) Sunflower 3,803 830 395 147 ... ... ... ... Pistachio nuts 5 145 3.3 0.13 ... ... ... ... Cashewnuts 1,196 349 46 139 ... ... ... ... Groundnuts 917 37.52 13.5 2.3 ... ... ... ... Macadamia 478.7 5,367.9 25.7 1,742.9 ... ... ... ... Desiccated coconut 86.3 15 15.6 2.13 64.3 1.8 9.9 0.5 Coconut milk/cream 4.72 - 0.61 - 113.46 0.24 23.04 0.06 Crude coconut oil 309.5 - 40 - 120.76 38 14.37 21.28 Coconut cosmetic oil 34.14 - 1.25 - 44.12 - 4.4 - Coconut cooking oil 129.96 27.23 5.41 98.83 0.4 - 0.39 - Crude palm oil 9,652.40 - 1,006.40 - Coco peat 4,349.59 - 130.86 - 2,431.40 - 98.09 - Coir rubberized mats 4,261 - 2.64 - Mature coconuts (pcs) - 2,175,117 - 13.96 - 177.33 - 0.02 Shell powder - - - - 69.17 - 2.14 - Source: AFFA “…”=data not yet available - = Category not applicable 17 <strong>Economic</strong> <strong>Review</strong> <strong>of</strong> <strong>Agriculture</strong> [ERA] <strong>2015</strong>
3.3 Horticulture Production and Exports This section on horticulture production analysis covers the performance in vegetables, fruits and cut flowers. 3.3.1 Tomato During the year under review, the area under tomatoes was 24,074 ha. The area increase from 20,985 ha in 2013 to 24,074 representing a 15 percent increase. The national production increased from 383,868 MT to 400,204 Mt while value increased from KES11.65 Billion to KES11.8 Billion. Tomato was mainly produced in Kajiado (14 percent), Bungoma (14 percent), Kirinyaga (10 percent) and Makueni (7 percent). In Kirinyaga and Kajiado, tomato is produced under irrigation schemes namely Mwea and Namelock schemes respectively. Green house tomatoes production has picked up with farmers. However, the main challenge has been bacterial wilt which caused some green houses to be abandoned, occasioning heavy loses to farmers. Table 3.19: Tomato County Area 2012 (ha) Production 2012 (Ton) Value 2012 (Kshs) Area 2013 (ha) Production 2013 (Ton) Value 2013 (Kshs) Area 2014 (ha) Production 2014 (Ton) Value 2014 (Kshs) Kajiado 1,603.00 35,937.00 921,000,007.90 1,668.00 50,884.00 961,525,000.00 1,680.00 47,368.00 1,624,120,000.00 Bungoma 1,344.00 39,232.00 1,221,390,000.00 1,474.00 41,568.00 1,227,503,000.00 1,700.00 50,399.00 1,610,977,500.00 Kirinyaga 1,903.20 59,464.00 1,159,215,000.00 1,795.50 30,774.00 750,080,000.00 1,647.50 48,560.00 1,155,700,000.00 Makueni 430.74 17,581.58 650,740,200.00 485.80 22,560.10 990,610,200.00 558.00 21,096.00 856,890,020.00 Kiambu 963.50 18,029.00 811,355,000.00 691.00 9,169.00 418,652,236.22 963.50 18,029.00 811,355,000.00 Tranzoia 480.00 9,270.00 129,060,000.00 623.20 17,395.20 302,240,000.00 628.00 14,848.00 416,000,207.00 Machakos 547.00 10,335.40 221,686,220.00 723.80 11,548.00 323,210,146.00 446.70 6,188.50 355,877,220.00 Kisii 876.00 15,590.00 331,150,000.00 951.00 16,985.00 363,850,000.00 937.20 16,664.00 350,630,000.00 Nakuru 509.25 6,745.00 601,523,826.00 495.20 8,668.00 515,594,478.00 633.30 17,510.90 346,710,000.00 Kisumu 822.00 12,218.93 346,598,000.00 1,537.00 14,307.00 444,347,600.00 1,477.00 16,720.00 328,133,058.00 Bomet 748.00 12,909.00 239,305,000.00 798.00 14,945.50 333,480,000.00 644.00 10,750.00 319,432,000.00 Elgeyo Marakwet 297.00 6,525.00 152,573,163.50 290.00 6,309.20 153,399,114.06 315.00 9,113.00 305,260,000.00 Homabay 1,000.00 6,004.00 165,602,000.00 1,052.00 9,543.00 300,350,000.00 897.00 9,051.00 292,128,250.00 Embu 194.00 5,218.00 136,540,000.00 255.00 7,375.00 185,415,000.00 237.00 7,746.00 274,825,000.00 Kericho 501.50 7,566.00 210,910,000.00 445.20 5,855.00 945,130,000.00 381.00 4,782.00 239,100,000.00 Tana River 128.00 5,805.00 145,125,000.00 140.00 6,325.00 158,125,000.00 248.00 9,190.00 233,800,000.00 Narok 175.00 2,213.00 156,400,846.10 233.00 3,532.00 211,226,377.00 245.60 3,307.00 214,501,394.00 Meru 375.00 8,820.00 290,900,000.00 344.00 11,830.00 405,150,000.00 254.00 4,775.15 208,705,015.00 Taita Taveta 138.00 5,024.80 159,458,578.00 222.30 9,889.70 396,966,543.40 218.50 5,187.30 164,615,404.00 Muranga 1,032.50 6,807.00 157,497,000.00 1,039.70 6,814.50 150,991,000.00 1,019.90 7,179.40 153,315,000.00 Laikipia 202.00 5,157.00 170,745,000.00 467.00 7,187.00 206,650,000.00 307.50 5,025.75 148,540,000.00 Siaya 873.00 6,430.00 122,800,000.00 835.00 6,295.00 138,405,000.00 819.00 7,118.00 147,328,000.00 Migori 1,204.00 7,800.00 34,800,000.00 1,160.00 6,950.00 80,285,750.00 1,179.00 8,590.00 142,800,000.00 <strong>Economic</strong> <strong>Review</strong> <strong>of</strong> <strong>Agriculture</strong> [ERA] <strong>2015</strong> 18