

Economic-Review-of-Agriculture_2015-6
Economic-Review-of-Agriculture_2015-6
Economic-Review-of-Agriculture_2015-6

You also want an ePaper? Increase the reach of your titles
YUMPU automatically turns print PDFs into web optimized ePapers that Google loves.
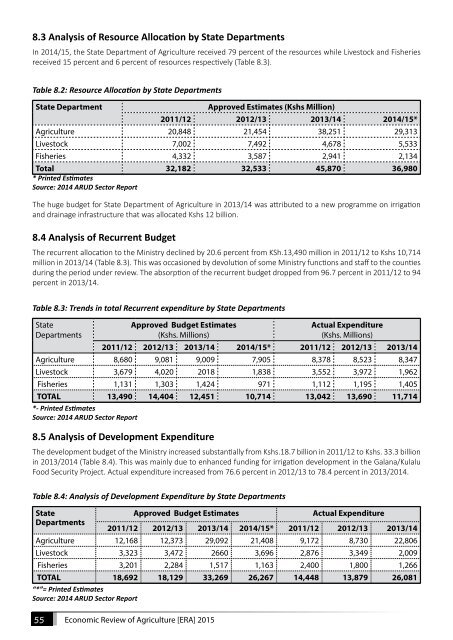
8.3 Analysis <strong>of</strong> Resource Allocation by State Departments<br />
In 2014/15, the State Department <strong>of</strong> <strong>Agriculture</strong> received 79 percent <strong>of</strong> the resources while Livestock and Fisheries<br />
received 15 percent and 6 percent <strong>of</strong> resources respectively (Table 8.3).<br />
Table 8.2: Resource Allocation by State Departments<br />
State Department<br />
Approved Estimates (Kshs Million)<br />
2011/12 2012/13 2013/14 2014/15*<br />
<strong>Agriculture</strong> 20,848 21,454 38,251 29,313<br />
Livestock 7,002 7,492 4,678 5,533<br />
Fisheries 4,332 3,587 2,941 2,134<br />
Total 32,182 32,533 45,870 36,980<br />
* Printed Estimates<br />
Source: 2014 ARUD Sector Report<br />
The huge budget for State Department <strong>of</strong> <strong>Agriculture</strong> in 2013/14 was attributed to a new programme on irrigation<br />
and drainage infrastructure that was allocated Kshs 12 billion.<br />
8.4 Analysis <strong>of</strong> Recurrent Budget<br />
The recurrent allocation to the Ministry declined by 20.6 percent from KSh.13,490 million in 2011/12 to Kshs 10,714<br />
million in 2013/14 (Table 8.3). This was occasioned by devolution <strong>of</strong> some Ministry functions and staff to the counties<br />
during the period under review. The absorption <strong>of</strong> the recurrent budget dropped from 96.7 percent in 2011/12 to 94<br />
percent in 2013/14.<br />
Table 8.3: Trends in total Recurrent expenditure by State Departments<br />
State<br />
Departments<br />
Approved Budget Estimates<br />
(Kshs. Millions)<br />
Actual Expenditure<br />
(Kshs. Millions)<br />
2011/12 2012/13 2013/14 2014/15* 2011/12 2012/13 2013/14<br />
<strong>Agriculture</strong> 8,680 9,081 9,009 7,905 8,378 8,523 8,347<br />
Livestock 3,679 4,020 2018 1,838 3,552 3,972 1,962<br />
Fisheries 1,131 1,303 1,424 971 1,112 1,195 1,405<br />
TOTAL 13,490 14,404 12,451 10,714 13,042 13,690 11,714<br />
*- Printed Estimates<br />
Source: 2014 ARUD Sector Report<br />
8.5 Analysis <strong>of</strong> Development Expenditure<br />
The development budget <strong>of</strong> the Ministry increased substantially from Kshs.18.7 billion in 2011/12 to Kshs. 33.3 billion<br />
in 2013/2014 (Table 8.4). This was mainly due to enhanced funding for irrigation development in the Galana/Kulalu<br />
Food Security Project. Actual expenditure increased from 76.6 percent in 2012/13 to 78.4 percent in 2013/2014.<br />
Table 8.4: Analysis <strong>of</strong> Development Expenditure by State Departments<br />
State<br />
Approved Budget Estimates<br />
Actual Expenditure<br />
Departments<br />
2011/12 2012/13 2013/14 2014/15* 2011/12 2012/13 2013/14<br />
<strong>Agriculture</strong> 12,168 12,373 29,092 21,408 9,172 8,730 22,806<br />
Livestock 3,323 3,472 2660 3,696 2,876 3,349 2,009<br />
Fisheries 3,201 2,284 1,517 1,163 2,400 1,800 1,266<br />
TOTAL 18,692 18,129 33,269 26,267 14,448 13,879 26,081<br />
“*”= Printed Estimates<br />
Source: 2014 ARUD Sector Report<br />
55<br />
<strong>Economic</strong> <strong>Review</strong> <strong>of</strong> <strong>Agriculture</strong> [ERA] <strong>2015</strong>