

Economic-Review-of-Agriculture_2015-6
Economic-Review-of-Agriculture_2015-6
Economic-Review-of-Agriculture_2015-6

You also want an ePaper? Increase the reach of your titles
YUMPU automatically turns print PDFs into web optimized ePapers that Google loves.
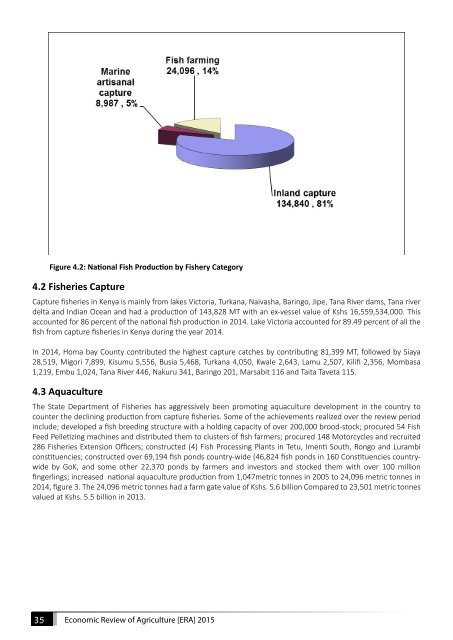
Figure 4.2: National Fish Production by Fishery Category<br />
4.2 Fisheries Capture<br />
Capture fisheries in Kenya is mainly from lakes Victoria, Turkana, Naivasha, Baringo, Jipe, Tana River dams, Tana river<br />
delta and Indian Ocean and had a production <strong>of</strong> 143,828 MT with an ex-vessel value <strong>of</strong> Kshs 16,559,534,000. This<br />
accounted for 86 percent <strong>of</strong> the national fish production in 2014. Lake Victoria accounted for 89.49 percent <strong>of</strong> all the<br />
fish from capture fisheries in Kenya during the year 2014.<br />
In 2014, Homa bay County contributed the highest capture catches by contributing 81,399 MT, followed by Siaya<br />
28,519, Migori 7,899, Kisumu 5,556, Busia 5,468, Turkana 4,050, Kwale 2,643, Lamu 2,507, Kilifi 2,356, Mombasa<br />
1,219, Embu 1,024, Tana River 446, Nakuru 341, Baringo 201, Marsabit 116 and Taita Taveta 115.<br />
4.3 Aquaculture<br />
The State Department <strong>of</strong> Fisheries has aggressively been promoting aquaculture development in the country to<br />
counter the declining production from capture fisheries. Some <strong>of</strong> the achievements realized over the review period<br />
include; developed a fish breeding structure with a holding capacity <strong>of</strong> over 200,000 brood-stock; procured 54 Fish<br />
Feed Pelletizing machines and distributed them to clusters <strong>of</strong> fish farmers; procured 148 Motorcycles and recruited<br />
286 Fisheries Extension Officers; constructed (4) Fish Processing Plants in Tetu, Imenti South, Rongo and Lurambi<br />
constituencies; constructed over 69,194 fish ponds country-wide (46,824 fish ponds in 160 Constituencies countrywide<br />
by GoK, and some other 22,370 ponds by farmers and investors and stocked them with over 100 million<br />
fingerlings; increased national aquaculture production from 1,047metric tonnes in 2005 to 24,096 metric tonnes in<br />
2014, figure 3. The 24,096 metric tonnes had a farm gate value <strong>of</strong> Kshs. 5.6 billion Compared to 23,501 metric tonnes<br />
valued at Kshs. 5.5 billion in 2013.<br />
35<br />
<strong>Economic</strong> <strong>Review</strong> <strong>of</strong> <strong>Agriculture</strong> [ERA] <strong>2015</strong>