

Economic-Review-of-Agriculture_2015-6
Economic-Review-of-Agriculture_2015-6
Economic-Review-of-Agriculture_2015-6

Create successful ePaper yourself
Turn your PDF publications into a flip-book with our unique Google optimized e-Paper software.
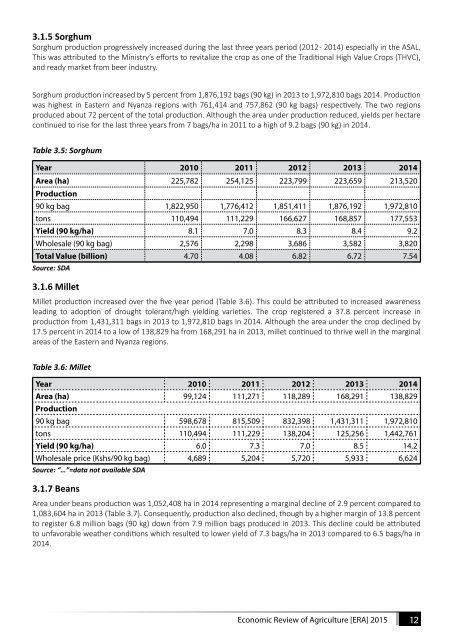
3.1.5 Sorghum<br />
Sorghum production progressively increased during the last three years period (2012 - 2014) especially in the ASAL.<br />
This was attributed to the Ministry’s efforts to revitalize the crop as one <strong>of</strong> the Traditional High Value Crops (THVC),<br />
and ready market from beer industry.<br />
Sorghum production increased by 5 percent from 1,876,192 bags (90 kg) in 2013 to 1,972,810 bags 2014. Production<br />
was highest in Eastern and Nyanza regions with 761,414 and 757,862 (90 kg bags) respectively. The two regions<br />
produced about 72 percent <strong>of</strong> the total production. Although the area under production reduced, yields per hectare<br />
continued to rise for the last three years from 7 bags/ha in 2011 to a high <strong>of</strong> 9.2 bags (90 kg) in 2014.<br />
Table 3.5: Sorghum<br />
Year 2010 2011 2012 2013 2014<br />
Area (ha) 225,782 254,125 223,799 223,659 213,520<br />
Production<br />
90 kg bag 1,822,950 1,776,412 1,851,411 1,876,192 1,972,810<br />
tons 110,494 111,229 166,627 168,857 177,553<br />
Yield (90 kg/ha) 8.1 7.0 8.3 8.4 9.2<br />
Wholesale (90 kg bag) 2,576 2,298 3,686 3,582 3,820<br />
Total Value (billion) 4.70 4.08 6.82 6.72 7.54<br />
Source: SDA<br />
3.1.6 Millet<br />
Millet production increased over the five year period (Table 3.6). This could be attributed to increased awareness<br />
leading to adoption <strong>of</strong> drought tolerant/high yielding varieties. The crop registered a 37.8 percent increase in<br />
production from 1,431,311 bags in 2013 to 1,972,810 bags in 2014. Although the area under the crop declined by<br />
17.5 percent in 2014 to a low <strong>of</strong> 138,829 ha from 168,291 ha in 2013, millet continued to thrive well in the marginal<br />
areas <strong>of</strong> the Eastern and Nyanza regions.<br />
Table 3.6: Millet<br />
Year 2010 2011 2012 2013 2014<br />
Area (ha) 99,124 111,271 118,289 168,291 138,829<br />
Production<br />
90 kg bag 598,678 815,509 832,398 1,431,311 1,972,810<br />
tons 110,494 111,229 138,204 125,256 1,442,761<br />
Yield (90 kg/ha) 6.0 7.3 7.0 8.5 14.2<br />
Wholesale price (Kshs/90 kg bag) 4,689 5,204 5,720 5,933 6,624<br />
Source: “…”=data not available SDA<br />
3.1.7 Beans<br />
Area under beans production was 1,052,408 ha in 2014 representing a marginal decline <strong>of</strong> 2.9 percent compared to<br />
1,083,604 ha in 2013 (Table 3.7). Consequently, production also declined, though by a higher margin <strong>of</strong> 13.8 percent<br />
to register 6.8 million bags (90 kg) down from 7.9 million bags produced in 2013. This decline could be attributed<br />
to unfavorable weather conditions which resulted to lower yield <strong>of</strong> 7.3 bags/ha in 2013 compared to 6.5 bags/ha in<br />
2014.<br />
<strong>Economic</strong> <strong>Review</strong> <strong>of</strong> <strong>Agriculture</strong> [ERA] <strong>2015</strong> 12