

Economic-Review-of-Agriculture_2015-6
Economic-Review-of-Agriculture_2015-6
Economic-Review-of-Agriculture_2015-6

Create successful ePaper yourself
Turn your PDF publications into a flip-book with our unique Google optimized e-Paper software.
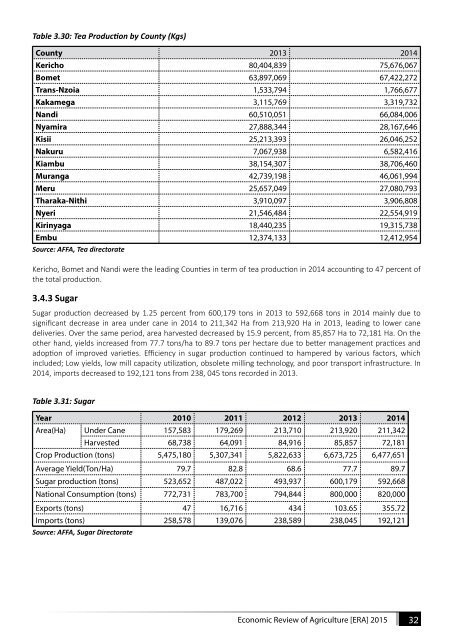
Table 3.30: Tea Production by County (Kgs)<br />
County 2013 2014<br />
Kericho 80,404,839 75,676,067<br />
Bomet 63,897,069 67,422,272<br />
Trans-Nzoia 1,533,794 1,766,677<br />
Kakamega 3,115,769 3,319,732<br />
Nandi 60,510,051 66,084,006<br />
Nyamira 27,888,344 28,167,646<br />
Kisii 25,213,393 26,046,252<br />
Nakuru 7,067,938 6,582,416<br />
Kiambu 38,154,307 38,706,460<br />
Muranga 42,739,198 46,061,994<br />
Meru 25,657,049 27,080,793<br />
Tharaka-Nithi 3,910,097 3,906,808<br />
Nyeri 21,546,484 22,554,919<br />
Kirinyaga 18,440,235 19,315,738<br />
Embu 12,374,133 12,412,954<br />
Source: AFFA, Tea directorate<br />
Kericho, Bomet and Nandi were the leading Counties in term <strong>of</strong> tea production in 2014 accounting to 47 percent <strong>of</strong><br />
the total production.<br />
3.4.3 Sugar<br />
Sugar production decreased by 1.25 percent from 600,179 tons in 2013 to 592,668 tons in 2014 mainly due to<br />
significant decrease in area under cane in 2014 to 211,342 Ha from 213,920 Ha in 2013, leading to lower cane<br />
deliveries. Over the same period, area harvested decreased by 15.9 percent, from 85,857 Ha to 72,181 Ha. On the<br />
other hand, yields increased from 77.7 tons/ha to 89.7 tons per hectare due to better management practices and<br />
adoption <strong>of</strong> improved varieties. Efficiency in sugar production continued to hampered by various factors, which<br />
included; Low yields, low mill capacity utilization, obsolete milling technology, and poor transport infrastructure. In<br />
2014, imports decreased to 192,121 tons from 238, 045 tons recorded in 2013.<br />
Table 3.31: Sugar<br />
Year 2010 2011 2012 2013 2014<br />
Area(Ha) Under Cane 157,583 179,269 213,710 213,920 211,342<br />
Harvested 68,738 64,091 84,916 85,857 72,181<br />
Crop Production (tons) 5,475,180 5,307,341 5,822,633 6,673,725 6,477,651<br />
Average Yield(Ton/Ha) 79.7 82.8 68.6 77.7 89.7<br />
Sugar production (tons) 523,652 487,022 493,937 600,179 592,668<br />
National Consumption (tons) 772,731 783,700 794,844 800,000 820,000<br />
Exports (tons) 47 16,716 434 103.65 355.72<br />
Imports (tons) 258,578 139,076 238,589 238,045 192,121<br />
Source: AFFA, Sugar Directorate<br />
<strong>Economic</strong> <strong>Review</strong> <strong>of</strong> <strong>Agriculture</strong> [ERA] <strong>2015</strong> 32