

Economic-Review-of-Agriculture_2015-6
Economic-Review-of-Agriculture_2015-6
Economic-Review-of-Agriculture_2015-6

You also want an ePaper? Increase the reach of your titles
YUMPU automatically turns print PDFs into web optimized ePapers that Google loves.
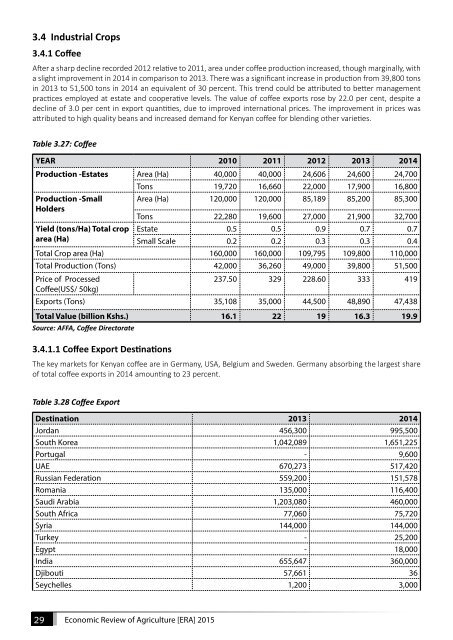
3.4 Industrial Crops<br />
3.4.1 C<strong>of</strong>fee<br />
After a sharp decline recorded 2012 relative to 2011, area under c<strong>of</strong>fee production increased, though marginally, with<br />
a slight improvement in 2014 in comparison to 2013. There was a significant increase in production from 39,800 tons<br />
in 2013 to 51,500 tons in 2014 an equivalent <strong>of</strong> 30 percent. This trend could be attributed to better management<br />
practices employed at estate and cooperative levels. The value <strong>of</strong> c<strong>of</strong>fee exports rose by 22.0 per cent, despite a<br />
decline <strong>of</strong> 3.0 per cent in export quantities, due to improved international prices. The improvement in prices was<br />
attributed to high quality beans and increased demand for Kenyan c<strong>of</strong>fee for blending other varieties.<br />
Table 3.27: C<strong>of</strong>fee<br />
YEAR 2010 2011 2012 2013 2014<br />
Production -Estates Area (Ha) 40,000 40,000 24,606 24,600 24,700<br />
Production -Small<br />
Holders<br />
Tons 19,720 16,660 22,000 17,900 16,800<br />
Area (Ha) 120,000 120,000 85,189 85,200 85,300<br />
Tons 22,280 19,600 27,000 21,900 32,700<br />
Yield (tons/Ha) Total crop Estate 0.5 0.5 0.9 0.7 0.7<br />
area (Ha)<br />
Small Scale 0.2 0.2 0.3 0.3 0.4<br />
Total Crop area (Ha) 160,000 160,000 109,795 109,800 110,000<br />
Total Production (Tons) 42,000 36,260 49,000 39,800 51,500<br />
Price <strong>of</strong> Processed<br />
C<strong>of</strong>fee(US$/ 50kg)<br />
237.50 329 228.60 333 419<br />
Exports (Tons) 35,108 35,000 44,500 48,890 47,438<br />
Total Value (billion Kshs.) 16.1 22 19 16.3 19.9<br />
Source: AFFA, C<strong>of</strong>fee Directorate<br />
3.4.1.1 C<strong>of</strong>fee Export Destinations<br />
The key markets for Kenyan c<strong>of</strong>fee are in Germany, USA, Belgium and Sweden. Germany absorbing the largest share<br />
<strong>of</strong> total c<strong>of</strong>fee exports in 2014 amounting to 23 percent.<br />
Table 3.28 C<strong>of</strong>fee Export<br />
Destination 2013 2014<br />
Jordan 456,300 995,500<br />
South Korea 1,042,089 1,651,225<br />
Portugal - 9,600<br />
UAE 670,273 517,420<br />
Russian Federation 559,200 151,578<br />
Romania 135,000 116,400<br />
Saudi Arabia 1,203,080 460,000<br />
South Africa 77,060 75,720<br />
Syria 144,000 144,000<br />
Turkey - 25,200<br />
Egypt - 18,000<br />
India 655,647 360,000<br />
Djibouti 57,661 36<br />
Seychelles 1,200 3,000<br />
29<br />
<strong>Economic</strong> <strong>Review</strong> <strong>of</strong> <strong>Agriculture</strong> [ERA] <strong>2015</strong>