

Economic-Review-of-Agriculture_2015-6
Economic-Review-of-Agriculture_2015-6
Economic-Review-of-Agriculture_2015-6

You also want an ePaper? Increase the reach of your titles
YUMPU automatically turns print PDFs into web optimized ePapers that Google loves.
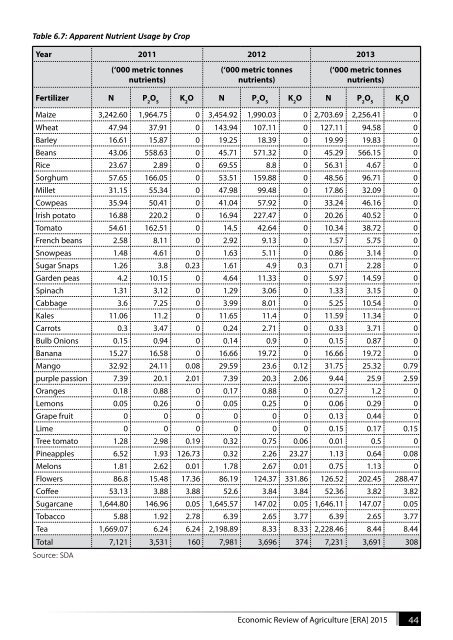
Table 6.7: Apparent Nutrient Usage by Crop<br />
Year 2011 2012 2013<br />
(‘000 metric tonnes<br />
nutrients)<br />
(‘000 metric tonnes<br />
nutrients)<br />
(‘000 metric tonnes<br />
nutrients)<br />
Fertilizer N P 2<br />
O 5<br />
K 2<br />
O N P 2<br />
O 5<br />
K 2<br />
O N P 2<br />
O 5<br />
K 2<br />
O<br />
Maize 3,242.60 1,964.75 0 3,454.92 1,990.03 0 2,703.69 2,256.41 0<br />
Wheat 47.94 37.91 0 143.94 107.11 0 127.11 94.58 0<br />
Barley 16.61 15.87 0 19.25 18.39 0 19.99 19.83 0<br />
Beans 43.06 558.63 0 45.71 571.32 0 45.29 566.15 0<br />
Rice 23.67 2.89 0 69.55 8.8 0 56.31 4.67 0<br />
Sorghum 57.65 166.05 0 53.51 159.88 0 48.56 96.71 0<br />
Millet 31.15 55.34 0 47.98 99.48 0 17.86 32.09 0<br />
Cowpeas 35.94 50.41 0 41.04 57.92 0 33.24 46.16 0<br />
Irish potato 16.88 220.2 0 16.94 227.47 0 20.26 40.52 0<br />
Tomato 54.61 162.51 0 14.5 42.64 0 10.34 38.72 0<br />
French beans 2.58 8.11 0 2.92 9.13 0 1.57 5.75 0<br />
Snowpeas 1.48 4.61 0 1.63 5.11 0 0.86 3.14 0<br />
Sugar Snaps 1.26 3.8 0.23 1.61 4.9 0.3 0.71 2.28 0<br />
Garden peas 4.2 10.15 0 4.64 11.33 0 5.97 14.59 0<br />
Spinach 1.31 3.12 0 1.29 3.06 0 1.33 3.15 0<br />
Cabbage 3.6 7.25 0 3.99 8.01 0 5.25 10.54 0<br />
Kales 11.06 11.2 0 11.65 11.4 0 11.59 11.34 0<br />
Carrots 0.3 3.47 0 0.24 2.71 0 0.33 3.71 0<br />
Bulb Onions 0.15 0.94 0 0.14 0.9 0 0.15 0.87 0<br />
Banana 15.27 16.58 0 16.66 19.72 0 16.66 19.72 0<br />
Mango 32.92 24.11 0.08 29.59 23.6 0.12 31.75 25.32 0.79<br />
purple passion 7.39 20.1 2.01 7.39 20.3 2.06 9.44 25.9 2.59<br />
Oranges 0.18 0.88 0 0.17 0.88 0 0.27 1.2 0<br />
Lemons 0.05 0.26 0 0.05 0.25 0 0.06 0.29 0<br />
Grape fruit 0 0 0 0 0 0 0.13 0.44 0<br />
Lime 0 0 0 0 0 0 0.15 0.17 0.15<br />
Tree tomato 1.28 2.98 0.19 0.32 0.75 0.06 0.01 0.5 0<br />
Pineapples 6.52 1.93 126.73 0.32 2.26 23.27 1.13 0.64 0.08<br />
Melons 1.81 2.62 0.01 1.78 2.67 0.01 0.75 1.13 0<br />
Flowers 86.8 15.48 17.36 86.19 124.37 331.86 126.52 202.45 288.47<br />
C<strong>of</strong>fee 53.13 3.88 3.88 52.6 3.84 3.84 52.36 3.82 3.82<br />
Sugarcane 1,644.80 146.96 0.05 1,645.57 147.02 0.05 1,646.11 147.07 0.05<br />
Tobacco 5.88 1.92 2.78 6.39 2.65 3.77 6.39 2.65 3.77<br />
Tea 1,669.07 6.24 6.24 2,198.89 8.33 8.33 2,228.46 8.44 8.44<br />
Total 7,121 3,531 160 7,981 3,696 374 7,231 3,691 308<br />
Source: SDA<br />
<strong>Economic</strong> <strong>Review</strong> <strong>of</strong> <strong>Agriculture</strong> [ERA] <strong>2015</strong> 44