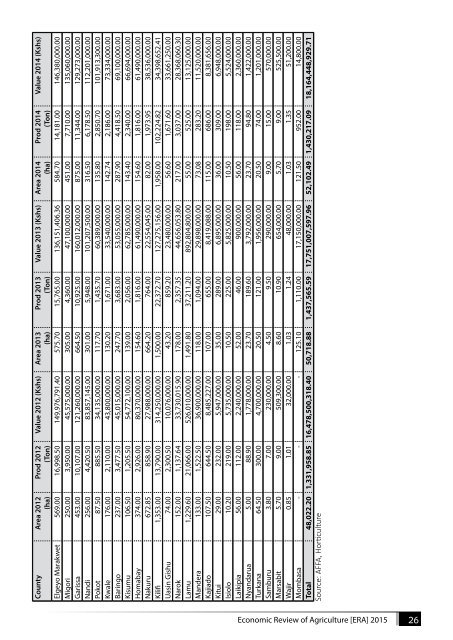
3.3.5 Banana Banana is an important source <strong>of</strong> income and food security among smallholders and large scale farmers. In 2014, the area under banana was 52,102 ha with a total production <strong>of</strong> 1.4 million tons valued at Kshs. 18.2 billion. The Area under production increased from 50,718 ha to 52,102 ka representing and value increase by Kshs 413 Million representing 3 percent and 2 percent respectively growth but production went down by 1 percent. The drop in production was attributed to low productivity in areas that do not have access to irrigation especially Murang’a and Bungoma. Counties <strong>of</strong> Meru, Kirinyaga, Embu and Taita Taveta recorded production <strong>of</strong> 47.28, 57.7, 48.8, and 50.66 per ha which could be attributed to access to water for irrigation, adoption <strong>of</strong> superior varieties, availability <strong>of</strong> clean planting materials from Tissue Culture technology, and exposure <strong>of</strong> farmers to modern agronomic practices. The main varieties grown include: dessert banana cultivars - Grandnain, Gross Mitchel, Williams’s hybrid, Lactan, Valery, Chinese Cavendish, Giant Cavendish, Dwarf Cavendish and Apple banana; cooking cultivars which include: Gradi Shisikame, MutaHato, Uganda Green and Ng’ombe and multipurpose cultivars such as Muraru and Goldfinger. The leading counties in banana production were; Meru (14 percent), Kirinyaga (12 percent), Embu (10 percent), Bungoma (8 percent) Taita Taveta (7 percent) Kisii (7 percent) and Muranga (6 percent) among others. Table 3.23: Bananas County Area 2012 (ha) Prod 2012 (Ton) Value 2012 (Kshs) Area 2013 (ha) Prod 2013 (Ton) Value 2013 (Kshs) Area 2014 (ha) Prod 2014 (Ton) Value 2014 (Kshs) Meru 6,194.20 288,803.00 2,675,480,000.00 6,493.00 307,013.00 3,422,330,000.00 6,146.00 215,580.00 2,475,820,000.00 Kirinyaga 3,434.00 185,402.00 1,818,220,000.00 3,627.00 209,601.00 2,288,660,000.00 3,768.00 192,230.80 2,206,497,600.00 Embu 3,026.00 147,791.00 1,479,685,000.00 3,363.00 164,374.00 1,646,528,000.00 3,634.00 177,924.00 1,782,248,000.00 Bungoma 3,029.00 57,143.00 1,084,520,000.00 3,413.00 65,166.00 1,231,072,000.00 3,980.00 75,234.00 1,428,277,500.00 Taita Taveta 2,450.20 126,727.00 1,296,067,503.10 2,569.00 130,154.80 364,001,891.80 2,513.60 129,739.60 1,236,000,089.00 Kisii 3,856.00 85,700.00 1,238,400,000.00 3,795.00 85,022.00 1,151,060,000.00 3,962.00 85,780.00 1,231,400,000.00 Muranga 5,696.40 94,981.00 941,920,000.00 5,819.75 99,737.00 1,122,677,000.00 5,874.00 101,753.00 1,141,552,000.00 Tharaka Nithi 2,049.00 80,900.00 1,039,330,000.00 2,137.50 75,920.00 963,720,000.00 2,148.50 79,823.00 1,139,761,500.00 Kakamega 2,485.00 31,557.00 797,060,000.00 2,578.60 34,254.00 945,575,650.00 2,745.60 35,378.00 1,015,805,772.00 Nyamira 1,356.00 26,162.00 561,140,000.00 1,431.00 28,066.00 629,830,000.00 2,363.00 47,160.00 931,900,000.00 Kiambu 1,828.20 21,843.70 357,172,400.00 1,830.50 23,654.40 408,350,380.00 1,959.68 23,322.66 404,838,000.00 Kericho 540.50 9,462.50 168,375,000.00 563.00 8,873.00 177,640,000.00 423.40 8,740.00 349,600,000.00 Vihiga 928.00 20,723.00 273,643,750.00 953.00 21,300.00 285,050,000.00 1,009.00 22,240.00 303,050,000.00 Tana River 1,448.00 15,226.00 263,640,000.00 1,550.00 15,986.00 276,240,000.00 1,605.00 16,462.00 279,730,000.00 Tranzoia 257.00 5,849.00 112,200,000.00 290.00 6,714.00 107,375,000.00 348.00 7,813.00 234,000,050.00 Makueni 411.00 4,081.80 71,791,000.00 524.00 4,874.00 112,596,000.00 696.00 5,871.00 197,356,000.00 Busia 360.00 7,007.00 173,735,000.00 362.00 7,171.00 189,783,000.00 467.00 7,315.00 192,355,000.00 Siaya 919.00 12,446.00 184,366,000.00 928.00 10,946.00 168,573,000.00 909.00 12,542.60 188,658,000.00 Machakos 1,114.20 19,379.40 273,948,086.00 1,219.00 20,682.00 301,298,627.00 1,188.45 9,873.00 177,987,000.00 Bomet 234.50 2,405.00 30,435,000.00 254.00 3,082.00 56,320,000.00 430.00 10,238.00 165,560,000.00 25 <strong>Economic</strong> <strong>Review</strong> <strong>of</strong> <strong>Agriculture</strong> [ERA] <strong>2015</strong>
County Area 2012 (ha) Prod 2012 (Ton) Value 2012 (Kshs) Area 2013 (ha) Prod 2013 (Ton) Value 2013 (Kshs) Area 2014 (ha) Prod 2014 (Ton) Value 2014 (Kshs) Elgeyo Marakwet 569.00 16,998.50 149,976,791.40 575.70 15,765.00 136,151,406.36 584.70 14,181.00 146,380,000.00 Migori 250.00 3,950.00 45,575,000.00 305.00 4,360.00 47,100,000.00 451.00 7,710.00 135,060,000.00 Garissa 453.00 10,107.00 121,260,000.00 664.50 10,925.00 160,012,000.00 875.00 11,344.00 129,273,000.00 Nandi 256.00 4,420.50 83,857,145.00 301.00 5,948.00 101,207,500.00 316.50 6,178.50 112,201,000.00 Pokot 87.50 885.50 34,135,000.00 117.70 1,435.70 60,389,000.00 135.80 2,850.70 101,913,300.00 Kwale 176.00 2,110.00 43,800,000.00 130.20 1,671.00 33,540,000.00 142.74 2,186.00 73,334,000.00 Baringo 237.00 3,477.50 45,015,000.00 247.70 3,683.00 53,055,000.00 287.90 4,418.50 69,100,000.00 Kisumu 106.50 1,205.50 54,772,100.00 139.00 2,056.00 62,785,000.00 143.40 2,340.00 66,694,000.00 Homabay 374.00 2,926.00 80,370,000.00 154.60 1,816.00 61,490,000.00 154.60 1,816.00 61,490,000.00 Nakuru 672.85 858.90 27,988,000.00 664.20 764.00 22,554,045.00 82.00 1,973.95 38,536,000.00 Kilifi 1,353.00 13,790.00 314,250,000.00 1,500.00 22,372.70 127,275,156.00 1,958.00 102,224.82 34,398,652.41 Uasin Gishu 74.00 2,300.50 10,076,000.00 43.20 859.20 23,480,000.00 56.60 1,671.60 33,661,250.00 Narok 152.00 1,137.64 33,730,015.90 178.00 2,357.35 44,656,053.80 217.00 3,037.00 28,368,060.30 Lamu 1,229.60 21,066.00 526,010,000.00 1,491.80 37,211.20 892,804,800.00 55.00 525.00 13,125,000.00 Mandera 133.00 1,522.50 36,900,000.00 118.00 1,094.00 29,898,000.00 73.08 283.20 11,520,000.00 Kajiado 107.50 644.50 8,485,227.00 107.00 655.00 8,419,088.00 115.00 686.00 8,381,656.00 Kitui 29.00 232.00 5,947,000.00 35.00 289.00 6,895,000.00 36.00 309.00 6,948,000.00 Isiolo 10.20 219.00 5,735,000.00 10.50 225.00 5,825,000.00 10.50 198.00 5,524,000.00 Laikipia 56.00 112.00 2,240,000.00 52.00 46.00 900,000.00 56.00 118.00 2,360,000.00 Nyandarua 5.00 88.90 1,778,000.00 23.70 189.60 3,792,000.00 23.70 94.80 1,422,000.00 Turkana 64.50 300.00 4,700,000.00 20.50 121.00 1,956,000.00 20.50 74.00 1,201,000.00 Samburu 3.80 7.00 230,000.00 4.50 9.50 290,000.00 9.00 15.00 570,000.00 Marsabit 5.70 9.00 509,300.00 8.60 10.90 654,000.00 5.70 9.00 525,500.00 Wajir 0.85 1.01 32,000.00 1.03 1.24 48,000.00 1.03 1.35 51,200.00 Mombasa - - - 125.10 1,110.00 17,150,000.00 121.50 952.00 14,800.00 Total 48,022.20 1,331,958.85 16,478,500,318.40 50,718.88 1,437,565.59 17,751,007,597.96 52,102.49 1,430,217.09 18,164,448,929.71 Source: AFFA, Horticulture <strong>Economic</strong> <strong>Review</strong> <strong>of</strong> <strong>Agriculture</strong> [ERA] <strong>2015</strong> 26