

Economic-Review-of-Agriculture_2015-6
Economic-Review-of-Agriculture_2015-6
Economic-Review-of-Agriculture_2015-6

You also want an ePaper? Increase the reach of your titles
YUMPU automatically turns print PDFs into web optimized ePapers that Google loves.
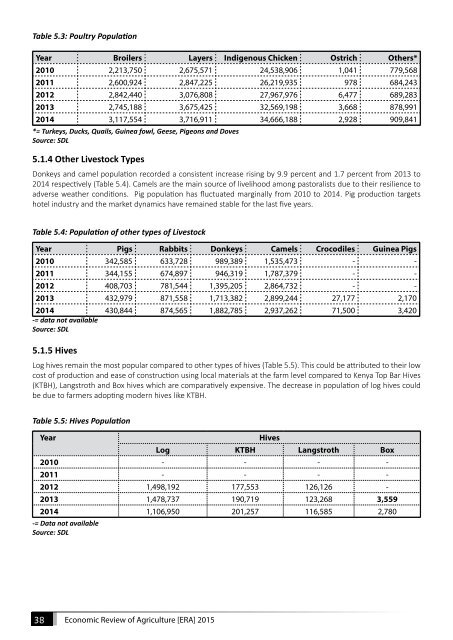
Table 5.3: Poultry Population<br />
Year Broilers Layers Indigenous Chicken Ostrich Others*<br />
2010 2,213,750 2,675,571 24,538,906 1,041 779,568<br />
2011 2,600,924 2,847,225 26,219,935 978 684,243<br />
2012 2,842,440 3,076,808 27,967,976 6,477 689,283<br />
2013 2,745,188 3,675,425 32,569,198 3,668 878,991<br />
2014 3,117,554 3,716,911 34,666,188 2,928 909,841<br />
*= Turkeys, Ducks, Quails, Guinea fowl, Geese, Pigeons and Doves<br />
Source: SDL<br />
5.1.4 Other Livestock Types<br />
Donkeys and camel population recorded a consistent increase rising by 9.9 percent and 1.7 percent from 2013 to<br />
2014 respectively (Table 5.4). Camels are the main source <strong>of</strong> livelihood among pastoralists due to their resilience to<br />
adverse weather conditions. Pig population has fluctuated marginally from 2010 to 2014. Pig production targets<br />
hotel industry and the market dynamics have remained stable for the last five years.<br />
Table 5.4: Population <strong>of</strong> other types <strong>of</strong> Livestock<br />
Year Pigs Rabbits Donkeys Camels Crocodiles Guinea Pigs<br />
2010 342,585 633,728 989,389 1,535,473 - -<br />
2011 344,155 674,897 946,319 1,787,379 - -<br />
2012 408,703 781,544 1,395,205 2,864,732 - -<br />
2013 432,979 871,558 1,713,382 2,899,244 27,177 2,170<br />
2014 430,844 874,565 1,882,785 2,937,262 71,500 3,420<br />
-= data not available<br />
Source: SDL<br />
5.1.5 Hives<br />
Log hives remain the most popular compared to other types <strong>of</strong> hives (Table 5.5). This could be attributed to their low<br />
cost <strong>of</strong> production and ease <strong>of</strong> construction using local materials at the farm level compared to Kenya Top Bar Hives<br />
(KTBH), Langstroth and Box hives which are comparatively expensive. The decrease in population <strong>of</strong> log hives could<br />
be due to farmers adopting modern hives like KTBH.<br />
Table 5.5: Hives Population<br />
Year<br />
Hives<br />
Log KTBH Langstroth Box<br />
2010 - - - -<br />
2011 - - - -<br />
2012 1,498,192 177,553 126,126 -<br />
2013 1,478,737 190,719 123,268 3,559<br />
2014 1,106,950 201,257 116,585 2,780<br />
-= Data not available<br />
Source: SDL<br />
38<br />
<strong>Economic</strong> <strong>Review</strong> <strong>of</strong> <strong>Agriculture</strong> [ERA] <strong>2015</strong>