Brasil só deve dominar Leitura em 260 anos, aponta estudo do Banco Mundial Relatorio Banco Mundial _Learning

You also want an ePaper? Increase the reach of your titles
YUMPU automatically turns print PDFs into web optimized ePapers that Google loves.
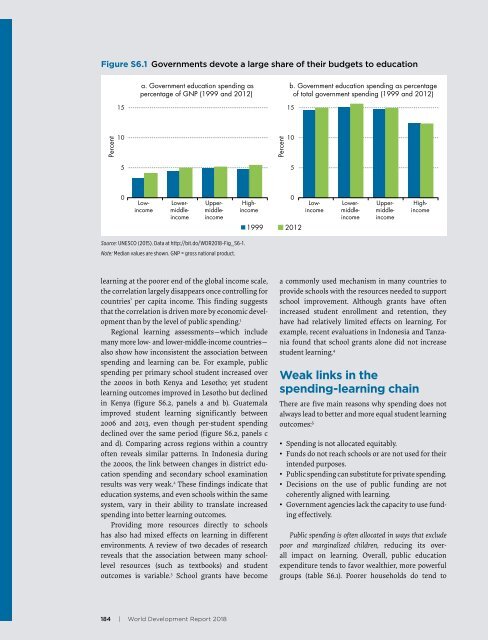
Figure S6.1 Governments devote a large share of their budgets to education<br />
a. Government education spending as<br />
percentage of GNP (1999 and 2012)<br />
b. Government education spending as percentage<br />
of total government spending (1999 and 2012)<br />
15<br />
15<br />
Percent<br />
10<br />
Percent<br />
10<br />
5<br />
5<br />
0<br />
0<br />
1999 2012<br />
Lowincome<br />
Lowermiddleincome<br />
Uppermiddleincome<br />
Highincome<br />
Lowincome<br />
Lowermiddleincome<br />
Uppermiddleincome<br />
Highincome<br />
Source: UNESCO (2015). Data at http://bit.<strong>do</strong>/WDR2018-Fig_S6-1.<br />
Note: Median values are shown. GNP = gross national product.<br />
learning at the poorer end of the global income scale,<br />
the correlation largely disappears once controlling for<br />
countries’ per capita income. This finding suggests<br />
that the correlation is driven more by economic <strong>deve</strong>lopment<br />
than by the level of public spending. 1<br />
Regional learning assessments—which include<br />
many more low- and lower-middle-income countries—<br />
also show how inconsistent the association between<br />
spending and learning can be. For example, public<br />
spending per primary school student increased over<br />
the 2000s in both Kenya and Lesotho; yet student<br />
learning outcomes improved in Lesotho but declined<br />
in Kenya (figure S6.2, panels a and b). Guate mala<br />
improved student learning significantly between<br />
2006 and 2013, even though per-student spending<br />
declined over the same period (figure S6.2, panels c<br />
and d). Comparing across regions within a country<br />
often reveals similar patterns. In In<strong>do</strong>nesia during<br />
the 2000s, the link between changes in district education<br />
spending and secondary school examination<br />
results was very weak. 2 These findings indicate that<br />
education syst<strong>em</strong>s, and even schools within the same<br />
syst<strong>em</strong>, vary in their ability to translate increased<br />
spending into better learning outcomes.<br />
Providing more resources directly to schools<br />
has also had mixed effects on learning in different<br />
environments. A review of two decades of research<br />
reveals that the association between many schoollevel<br />
resources (such as textbooks) and student<br />
outcomes is variable. 3 School grants have become<br />
a commonly used mechanism in many countries to<br />
provide schools with the resources needed to support<br />
school improv<strong>em</strong>ent. Although grants have often<br />
increased student enrollment and retention, they<br />
have had relatively limited effects on learning. For<br />
example, recent evaluations in In<strong>do</strong>nesia and Tanzania<br />
found that school grants alone did not increase<br />
student learning. 4<br />
Weak links in the<br />
spending-learning chain<br />
There are five main reasons why spending <strong>do</strong>es not<br />
always lead to better and more equal student learning<br />
outcomes: 5<br />
• Spending is not allocated equitably.<br />
• Funds <strong>do</strong> not reach schools or are not used for their<br />
intended purposes.<br />
• Public spending can substitute for private spending.<br />
• Decisions on the use of public funding are not<br />
coherently aligned with learning.<br />
• Government agencies lack the capacity to use funding<br />
effectively.<br />
Public spending is often allocated in ways that exclude<br />
poor and marginalized children, reducing its overall<br />
impact on learning. Overall, public education<br />
expenditure tends to favor wealthier, more powerful<br />
groups (table S6.1). Poorer households <strong>do</strong> tend to<br />
184 | World Development Report 2018